

Data Export: reports and schedules
What each Data Export report contains, when it arrives, and how to choose between raw, aggregated, cohort, partner, cost, subscription and fraud datasets.
Data Export sends AdShift data to your own warehouse or storage bucket, so your BI, finance and data teams can work from the same numbers you see in AdShift.
This article explains the reports you can enable on a Data Export connection. For destination setup, use the destination-specific guides in See also.
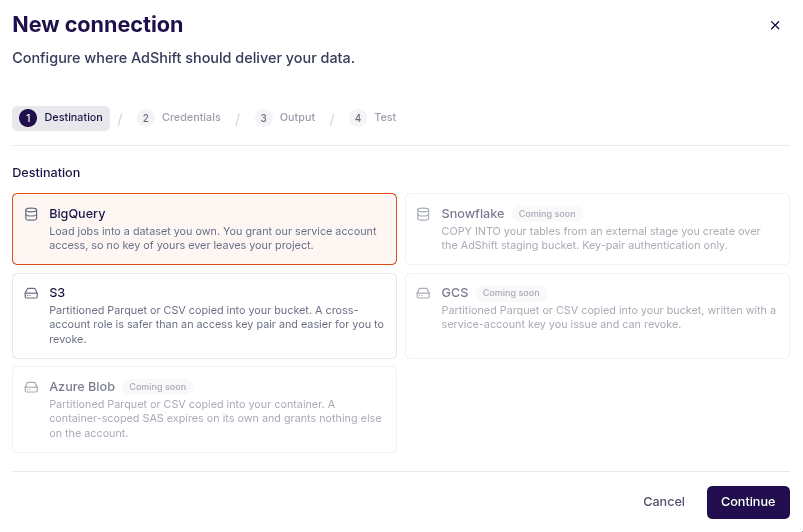
How exports are organised
Each Data Export connection has one or more reports. A report is one dataset, such as Conversions, Campaign performance (hourly) or Cohort retention and revenue.
For every report you can usually choose:
- Fields - keep the default field set, or select only the columns you need.
- Filters - limit the export by app, media source, country, campaign, event name or another report-specific dimension.
- Cadence - hourly or daily, depending on the report.
Hourly reports are partitioned by EVENT_DATE and EVENT_HOUR. Daily reports are partitioned by EVENT_DATE. In file destinations, those partitions appear in the path. In BigQuery, they become table partitions.
If a report is marked as versioned, a partition can be restated later because the source data is expected to change. For file destinations, a restated partition is written under a newer version folder. For BigQuery, AdShift replaces the matching partition.
Which report should I use?
Use this as the quick decision guide:
| You want to... | Start with |
|---|---|
| Rebuild attribution, install or event-level reporting in your warehouse | User acquisition reports |
| Build dashboards without processing raw event streams | Aggregated performance reports |
| Analyse retention, LTV or revenue by install cohort | Cohorts and retention reports |
| Reconcile AdShift numbers with Meta, Google Ads, Apple Search Ads or TikTok | Partner insights reports |
| Export ad spend exactly as ingested from networks | Cost reports |
| Analyse subscriptions, MRR, churn or trial conversion | Subscriptions reports |
| Inspect or summarise blocked traffic | Fraud protection reports |
User acquisition reports
These are event-level datasets. They are the most flexible, and usually the largest. Use them when you need row-level data or when your warehouse will do its own modelling.
| Report | What it contains | Cadence |
|---|---|---|
| Conversions | One row per attributed conversion: installs, re-attributions and re-engagements, with attribution details. | Hourly or daily |
| In-app events | Attributed in-app events with the attribution source that earned them. High volume; filter by event name when possible. | Hourly or daily |
| In-app events (pre-attribution) | SDK events before attribution. Use it to reconcile SDK-side counts against attributed counts. | Hourly or daily |
| Clicks | Attribution-link clicks, including campaign structure, cost data and deep-link parameters. | Hourly or daily |
| Impressions | Attribution-link impressions, including viewability metrics when a network sends them. | Hourly or daily |
| Sessions | App sessions with first-touch and last-touch attribution and time spent. | Hourly or daily |
| SKAN postbacks | Raw SKAdNetwork and AdAttributionKit postbacks as Apple delivered them. | Hourly or daily |
| Outbound postback audit | One row per partner postback attempt, including HTTP status and retry index. | Hourly or daily |
Some fields in these reports can be personal data, for example advertising identifiers, IP address, device fingerprint or user agent. They are not the best default choice for lightweight dashboards. Use them when you need the raw event detail and have a reason to store those fields in your own systems.
Aggregated performance reports
Aggregated reports are smaller and are usually the right choice for dashboards. They are built from AdShift's marts, so you do not need to aggregate raw clicks, conversions or events yourself.
| Report | What it contains | Cadence |
|---|---|---|
| Campaign performance (hourly) | Installs, revenue, cost, clicks and impressions by campaign and hour, with revenue split by source. | Daily by default; hourly optional |
| Ad performance (hourly) | The same performance view one grain lower, at ad level. | Daily by default; hourly optional |
| Ad revenue breakdown | Ad revenue rolled up by ad network and placement. | Daily |
| Event metrics | Per-event-name counts, unique users and revenue by hour. | Daily by default; hourly optional |
| Sessions (daily) | Daily sessions, active users and engagement by acquisition source. | Daily |
| Partner performance (daily) | AdShift-attributed performance per media source, unioned across partners. | Daily |
| SDK adoption | Device share by SDK version, OS version, app version and ATT status. | Daily |
| SKAN postbacks (decoded) | SKAN postbacks aggregated per hour with conversion values decoded from your app's mapping. | Daily by default; hourly optional |
For most dashboards, start here. Move to event-level reports only when the aggregated grain does not answer the question.
Cohorts and retention reports
Cohort reports are daily and versioned, because recent cohorts are recalculated as more events arrive.
| Report | What it contains |
|---|---|
| Cohort size | Cohort denominators: the number of users in each cohort grain. |
| Cohort retention and revenue | Retained users and revenue per cohort day offset, up to day 180. Join it to Cohort size for rates. |
| Monthly revenue by install cohort | Revenue by activity month and install cohort, over a 24-month horizon. Use it for longer payback and LTV analysis. |
These reports may require the cohort reports feature on your plan.
Partner insights reports
Partner insights export the numbers as ad networks report them, next to AdShift-attributed data in your own warehouse. They are daily and versioned because networks can restate recent performance.
| Report | What it contains |
|---|---|
| Campaign performance | Campaign spend and results from Meta, Google Ads, Apple Search Ads and TikTok. |
| Ad group performance | Ad group performance; for Meta this is ad set performance. |
| Ad performance | Ad-level performance, currently for networks that provide ad-level data. |
| Keyword performance | Keyword-level performance for search networks. |
| Campaign performance by country | Campaign performance split by country. |
Use the MEDIA_SOURCE field to split or filter by network. Older per-network report names are replaced by these combined network reports.
These reports may require the partner insights feature on your plan.
Cost reports
Cost reports are daily and versioned because network cost imports rescan recent days.
| Report | What it contains |
|---|---|
| Cost reports | Campaign-grain ad spend as ingested from the networks. |
| Cost reports (daily rollup) | Ad spend rolled up by app, media source and day, with cost in USD. |
Use cost reports when finance or BI needs the spend source of truth, not only the spend already joined into performance reports.
These reports may require the cost reports feature on your plan.
Subscription reports
Subscription reports are daily and versioned, because subscription state can change after the original activity date.
| Report | What it contains |
|---|---|
| Subscription MRR | Daily MRR with new, expansion, contraction and churn movements. |
| Subscription churn | Cancellations, expirations and reactivations by day. |
| Trial conversion | Trial starts and trial-to-paid conversion by day. |
These reports may require the subscription reports feature on your plan.
Fraud protection reports
Fraud reports are available when Fraud Protection is enabled.
| Report | What it contains | Cadence |
|---|---|---|
| Blocked traffic (event level) | One row per blocked request, with fraud reasons, GeoIP and ASN enrichment. | Hourly or daily |
| Blocked traffic summary | Blocked request counts per hour, media source and block layer. | Daily by default; hourly optional |
Use the summary for dashboards. Use event-level blocked traffic when you need to investigate individual blocked requests.
Freshness and delivery history
Hourly event-level reports are usually available one to two hours after the hour closes. Aggregated daily reports are usually delivered in the early morning UTC. Partner, cost, cohort and subscription reports can arrive later because they depend on network imports or recalculated marts.
The report picker shows the expected freshness for each report. Delivery history shows one row per report, partition and attempt, with:
- Succeeded - data landed in the destination.
- Skipped - the partition had no rows after filters.
- Failed - AdShift or the destination reported an error. Open the run to see the exact message.
For BigQuery, each report becomes a table named after its dataset key. For file destinations, each report is written under a t=<dataset_key>/dt=<date> path, with h=<hour> for hourly partitions.
Practical recommendations
- Start with aggregated reports for dashboards. They are cheaper to store and faster to query.
- Add event-level reports only for datasets your team actually uses. In-app events can be very large.
- Filter high-volume reports by app, event name, media source or country when possible.
- Keep personal-data fields out of the default selection unless your use case requires them.
- Prefer BigQuery when analysts will query the data directly. Prefer file destinations when your data platform already has an ingestion pipeline.
See also
- Data Export to BigQuery - create a BigQuery dataset and grant AdShift access
- Data Export to Amazon S3 - write files to a bucket you own
- Data Export to Google Cloud Storage - write files to a GCS bucket
- Data Export to Azure Blob Storage - write files to Azure Storage
- Data Export to Snowflake - deliver data to your Snowflake account
Data Export to Snowflake: setup step by step
How to create the role, key pair and external stage AdShift needs to COPY exported partitions into your Snowflake account.
Conversion Studio
SKAN Conversion Studio lets you define what your SKAdNetwork conversion values measure — revenue, in-app events, or a funnel — without changing your app code. Configure, validate, and publish a schema for each iOS app.