

SKAN Overview
Read your iOS SKAdNetwork results — decoded installs and revenue, with diagnostics for how trustworthy the SKAN signal is.
SKAN Overview is where you read your iOS SKAdNetwork performance — decoded installs, revenue, and campaign results — plus diagnostics that tell you how much to trust the SKAN signal. It's the counterpart to the main Analyze: Overview dashboard, focused on the privacy-constrained part of iOS.
Open it from Analyze → SKAN Overview. Amounts are in USD, and the page is filtered to iOS apps only.
New to SKAN? Start with What is SKAN? for the concepts behind everything on this page.
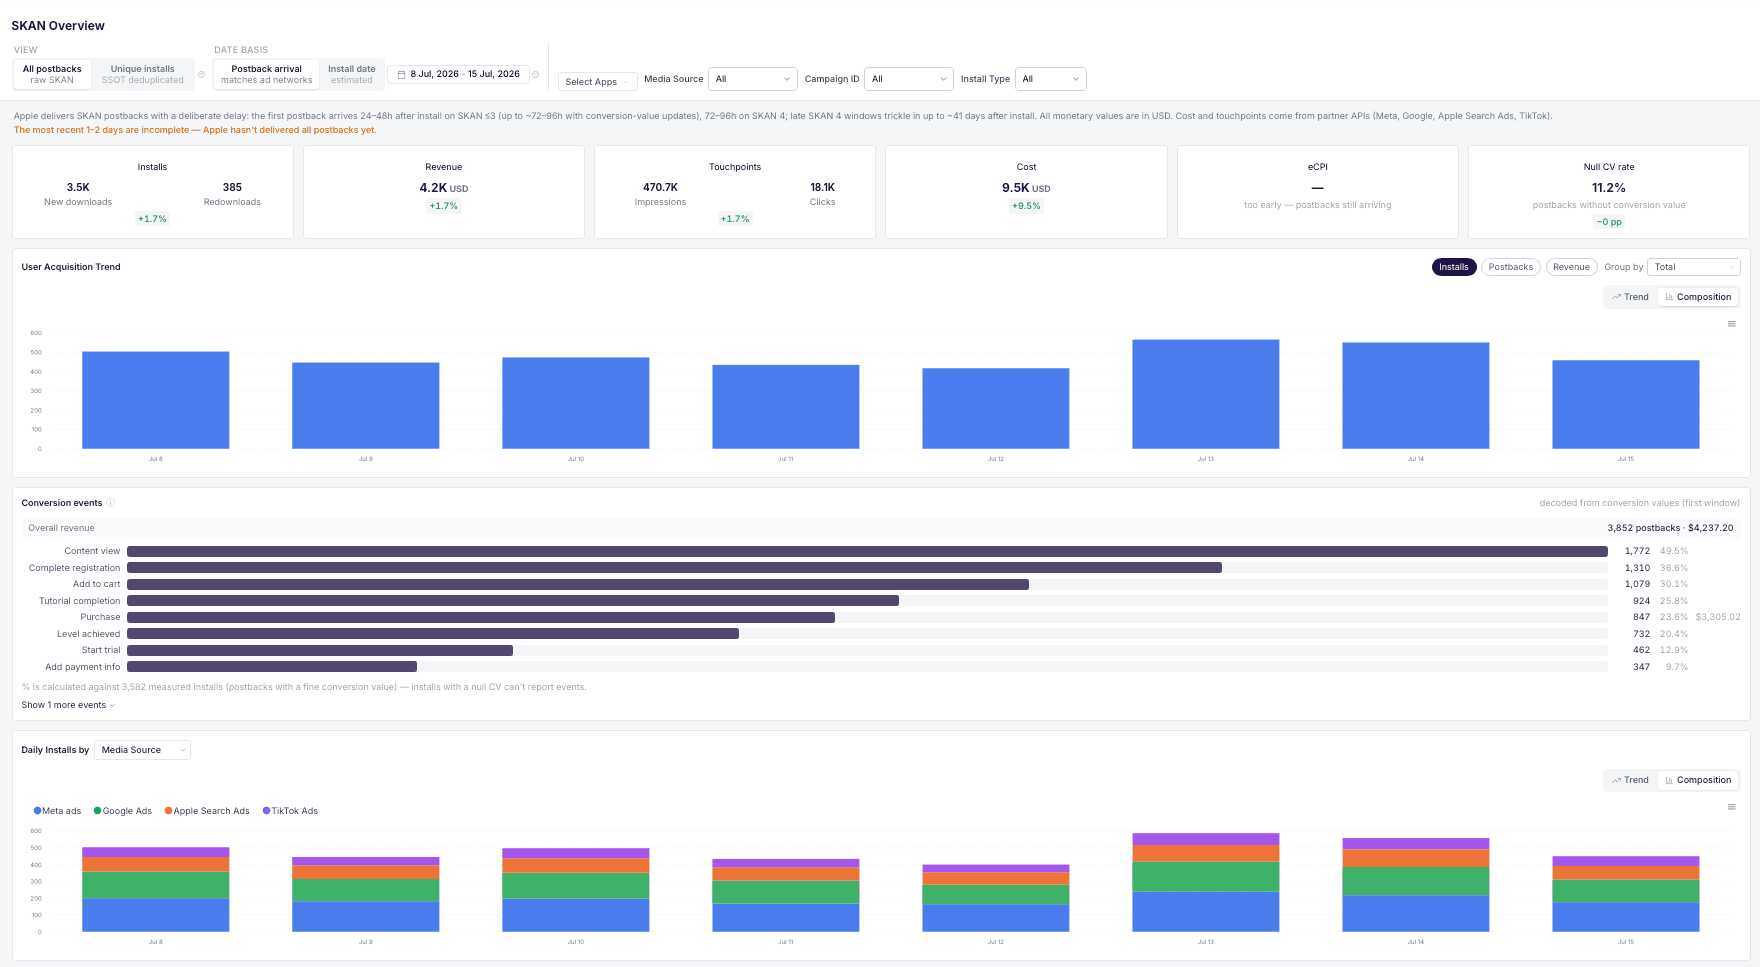
A note on timing. Apple delivers postbacks on a deliberate delay: the first arrives ~24–48h after install on SKAN 3 and earlier (up to ~72–96h once conversion-value updates are included), and ~72–96h on SKAN 4; the later SKAN 4 windows keep trickling in for up to ~41 days. So the most recent days are always incomplete and will keep rising — this is normal, not missing data.
First, two switches that frame everything
Two controls change what every number on the page means. Worth 30 seconds before anything else.
View
- All postbacks (raw SKAN) — every SKAN install exactly as Apple reports it. The full iOS volume.
- Unique installs (SSOT deduplicated) — the same data with duplicates removed where AdShift already attributed the install device-level. One honest number across SKAN and deterministic attribution.
In Unique installs mode, a banner reports how many duplicate SKAN installs were removed because they were already attributed another way. This is the same idea as the Single Source of Truth mode on Analyze: Overview. (A few diagnostic panels can't be de-duplicated and carry a small "not deduplicated" note in this mode.)
Date basis
- Postback arrival — group data by when Apple delivered the postback. Matches what ad networks report.
- Install date (estimated) — group data by the install date AdShift estimates from the postback. Better for lining SKAN up with your other install reports.
Because the two axes place the same postback on different days, the same range can show different daily shapes depending on which basis you pick.
If a large share of install postbacks arrives without a value AdShift can read, a decode issue banner appears with the affected percentage — usually a sign of a schema mismatch worth checking in SKAN Conversion Studio.
Headline metrics
The cards at the top summarize the selected period.
| Card | What it measures |
|---|---|
| Installs | Split into New downloads and Redownloads. In Unique installs mode this becomes Unique installs and Unknown status. |
| Revenue | Total revenue (USD) decoded from the conversion values. |
| Null CV rate | Share of postbacks that arrived without a conversion value (Apple withheld it). A high rate points to low per-campaign volume. |
When cost and touchpoint data is available from your connected networks (and you haven't narrowed the view with a campaign or install-type filter), three more cards appear:
| Card | What it measures |
|---|---|
| Touchpoints | Ad Impressions and Clicks reported by the networks. |
| Cost | Ad spend (USD) from your connected network accounts. |
| eCPI | Effective cost per install: cost ÷ SKAN installs. |
There is no "click-to-install rate" card — the cost-efficiency metric here is eCPI.
Charts
Read top to bottom, from overall shape down to detail. All charts share the filters and the View / Date basis switches.
- User Acquisition Trend — a trend of Installs, Postbacks, or Revenue over time, grouped by Total, Media Source, Campaign ID, Install Type, or Interaction Type. Top-N (5 / 10 / all) and a line-vs-composition (stacked) toggle. The incomplete recent tail is marked.
- Conversion events — decoded in-app events ranked as horizontal bars, with overall revenue pinned on top and an expandable tail for the long list.
- Daily Installs by … — stacked daily install bars, split by the dimension you choose.
- Group by … (donuts) — three rings side by side: Installs, Revenue, and Converted installs, showing how each splits across a dimension.
- Revenue per user by … — revenue-per-install as horizontal bars for the top contributors.
Breakdown table
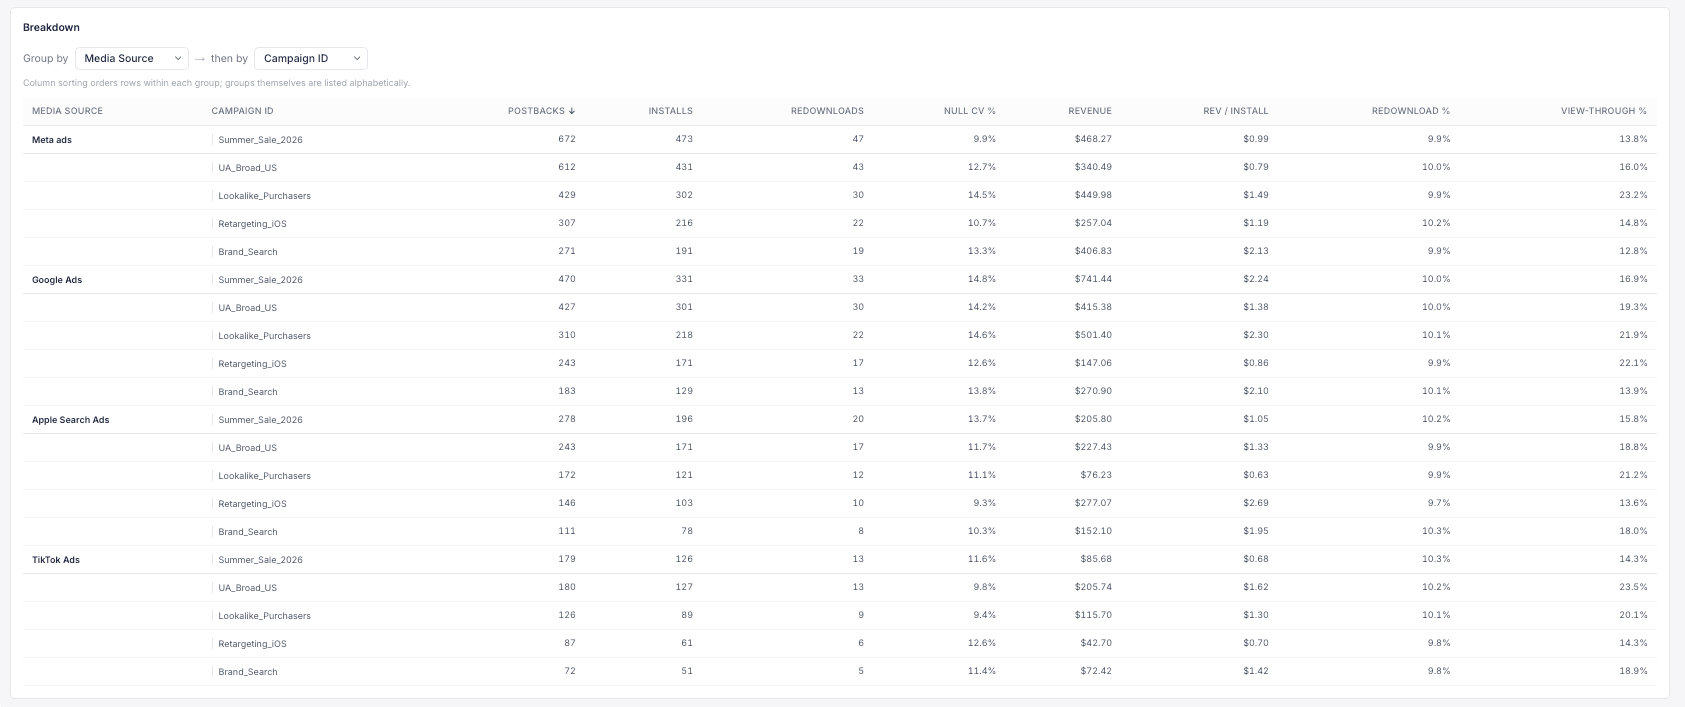
The table is where you go from "what" to "which one exactly". It's a two-level grouping: pick a Group by dimension and then a then by dimension to nest under it.
Dimensions: Media Source · Campaign ID · Install Type · Interaction Type.
| Column | Description |
|---|---|
| Postbacks | Total postbacks received |
| Installs | Decoded installs |
| Redownloads | Decoded redownloads |
| Null CV % | Share of this group's postbacks with no conversion value |
| Revenue | Decoded revenue (USD) |
| Rev / Install | Revenue divided by installs |
| Redownload % | Redownloads as a share of installs |
| View-through % | Share attributed to a view (impression) rather than a click |
Sorting reorders rows within each group while the groups themselves stay alphabetical. Large result sets are capped (up to 500 rows, paginated by group) with a note when the list is truncated.
Data quality
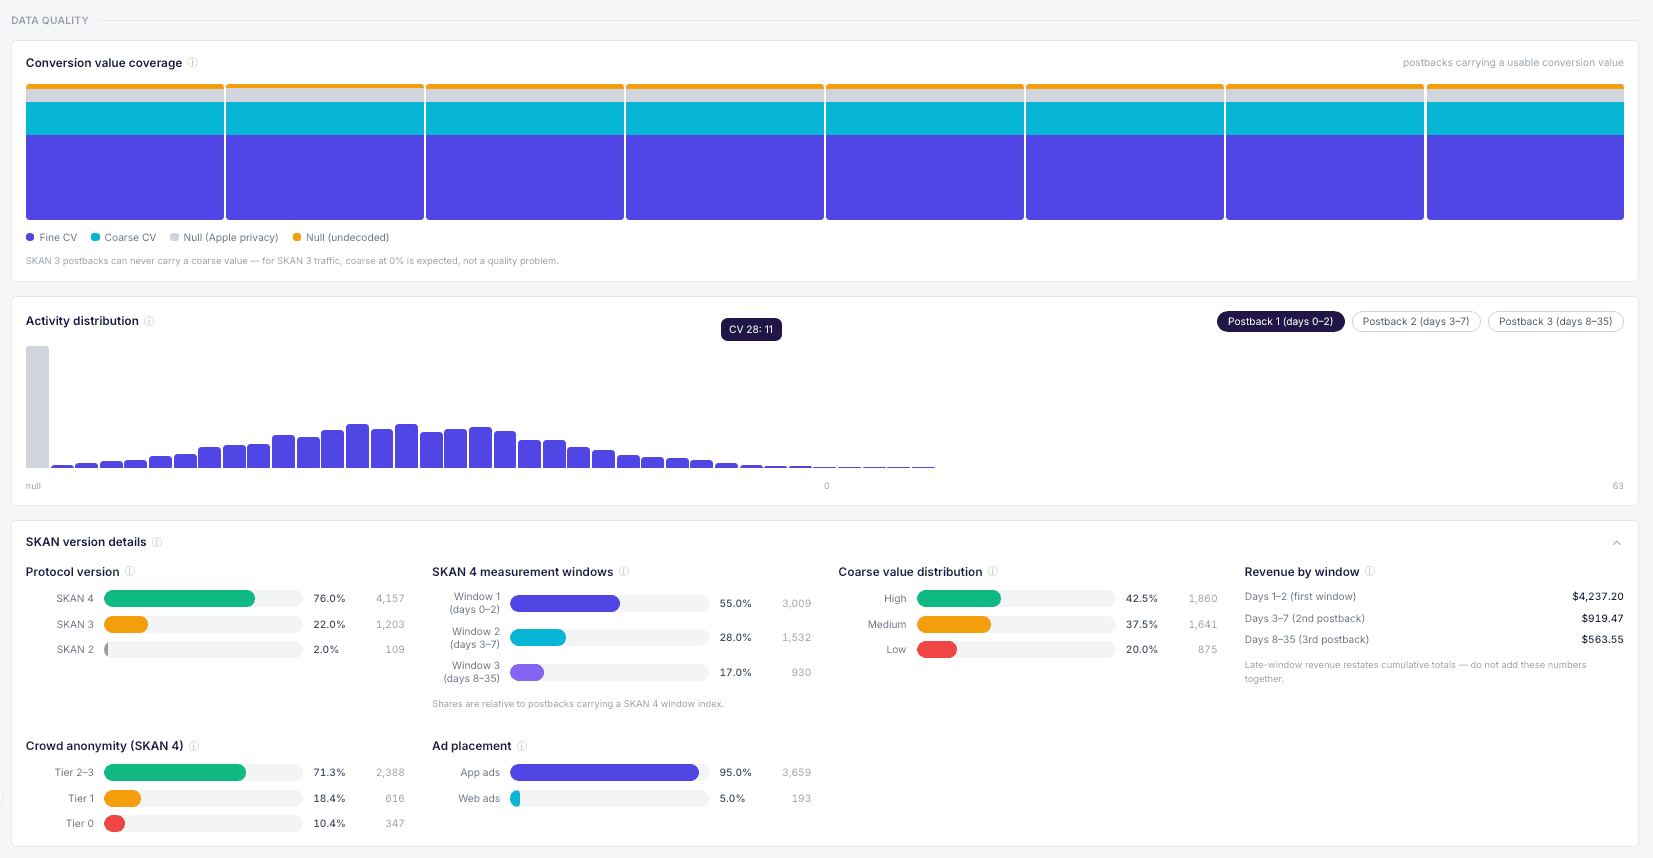
SKAN is only as useful as it is trustworthy, so the bottom of the page is a dedicated Data quality section. Use it to judge how much of your data is precise, bucketed, or missing.
- Conversion value coverage — daily stacked bars splitting postbacks into Fine CV, Coarse CV, Null (Apple privacy), and Null (undecoded). The two null types matter: "Apple privacy" is volume Apple withheld; "undecoded" is a value we received but couldn't map — the second is something you can fix.
- Activity distribution — a histogram of the fine conversion values (0–63) plus a null bar, with tabs to switch between windows.
- SKAN version details — a collapsible panel with the protocol-version mix (SKAN 4 / 3 / 2), the SKAN 4 measurement windows, the coarse-value distribution (High / Medium / Low), revenue by window, crowd-anonymity tiers, and ad placement (App / Web).
Filters
Everything on the page follows the filter bar. Your selections are remembered between visits.
| Filter | Description |
|---|---|
| View | All postbacks (raw SKAN) · Unique installs (SSOT deduplicated) |
| Date basis | Postback arrival · Install date (estimated) |
| Date range | The period to analyze, on the selected date basis |
| App | One iOS app in your project |
| Media Source | A specific ad network, or All |
| Campaign ID | A specific campaign, or All |
| Install Type | All · New download · Redownload |
There is no Country breakdown or filter on this dashboard — SKAN's aggregation limits make reliable per-country splits impossible.
SKAN vs Single Source of Truth
The View switch is really a choice between two questions:
- All postbacks answers "how much did Apple report for iOS?" — the full, raw volume.
- Unique installs (SSOT) answers "how many real, non-duplicated installs did I get?" — SKAN installs minus the ones AdShift already attributed device-level.
Neither is "more correct" — they answer different questions. Use raw SKAN to see Apple's full count; use SSOT when you're combining SKAN with the rest of your attribution and don't want to count an install twice. The same de-duplication drives the Single Source of Truth mode on Analyze: Overview.
See also
- What is SKAN? — the concepts behind this dashboard
- SKAN Conversion Studio — configure what your conversion values measure
- Analyze: Overview — unified attribution, including Single Source of Truth
- Apple Search Ads — connect Apple Ads for iOS campaign costs and SKAN installs
SDK Information
See which app, SDK and OS versions your users are running, what devices they use, and how ATT consent is trending on iOS. The page to check before you drop support for an old version or ship a privacy change.
Network Self-Reports
Network Self-Reports shows performance data as reported directly by each ad network — spend, impressions, and campaign metrics from Meta, Apple, and TikTok.