

Custom Dashboards
Custom Dashboards let you build your own analytics view in AdShift by combining metrics, dimensions, filters, charts, KPI tiles, and tables in one place.
Custom Dashboards help you build your own analytics view in AdShift by combining metrics, dimensions, filters, charts, KPI tiles, and tables in one place. Instead of switching between separate reports, you can create a dashboard that answers the exact question you care about: campaign performance, monetization, retention, event activity, or a mix of all of them.
Use Custom Dashboards when you want to:
- Track the same set of KPIs every day.
- Compare paid, organic, and retargeting performance in one view.
- Build dashboards for a team, client, channel, country, campaign, ad set, or media source.
- Save report settings instead of rebuilding them from scratch.
- Share a specific dashboard view with other users in your project.
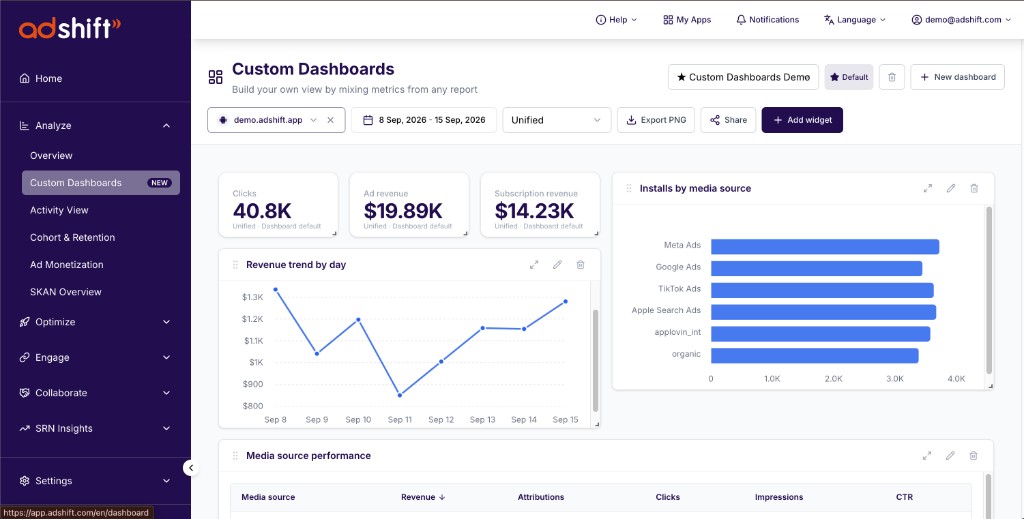
Where to find Custom Dashboards
Go to Analyze -> Custom Dashboards.
The page includes:
- A dashboard selector for switching between saved dashboards.
- A New dashboard button for creating additional dashboards.
- Global controls for selected apps, date range, and view type.
- A Share button for making a dashboard private or available to your project.
- An Add widget button for building the actual dashboard content.
Create or choose a dashboard
Use the dashboard selector at the top of the page to switch between dashboards. Use New dashboard when you want to create a separate workspace, for example:
- Executive overview.
- UA performance.
- Retention and events.
- Revenue monitoring.
- Campaign deep dive.
If you work with one dashboard most often, click Set as default. AdShift will open that dashboard first when you return to Custom Dashboards.
Set the dashboard scope
Before adding widgets, choose the global scope for the dashboard:
- Apps: select which apps the dashboard should report on.
- Date range: choose the default reporting window.
- View type: switch between Unified, User Acquisition, and Retargeting views.
These settings act as defaults for widgets. Individual widgets can still narrow their own date range, view type, filters, or breakdowns when needed.
Add a widget
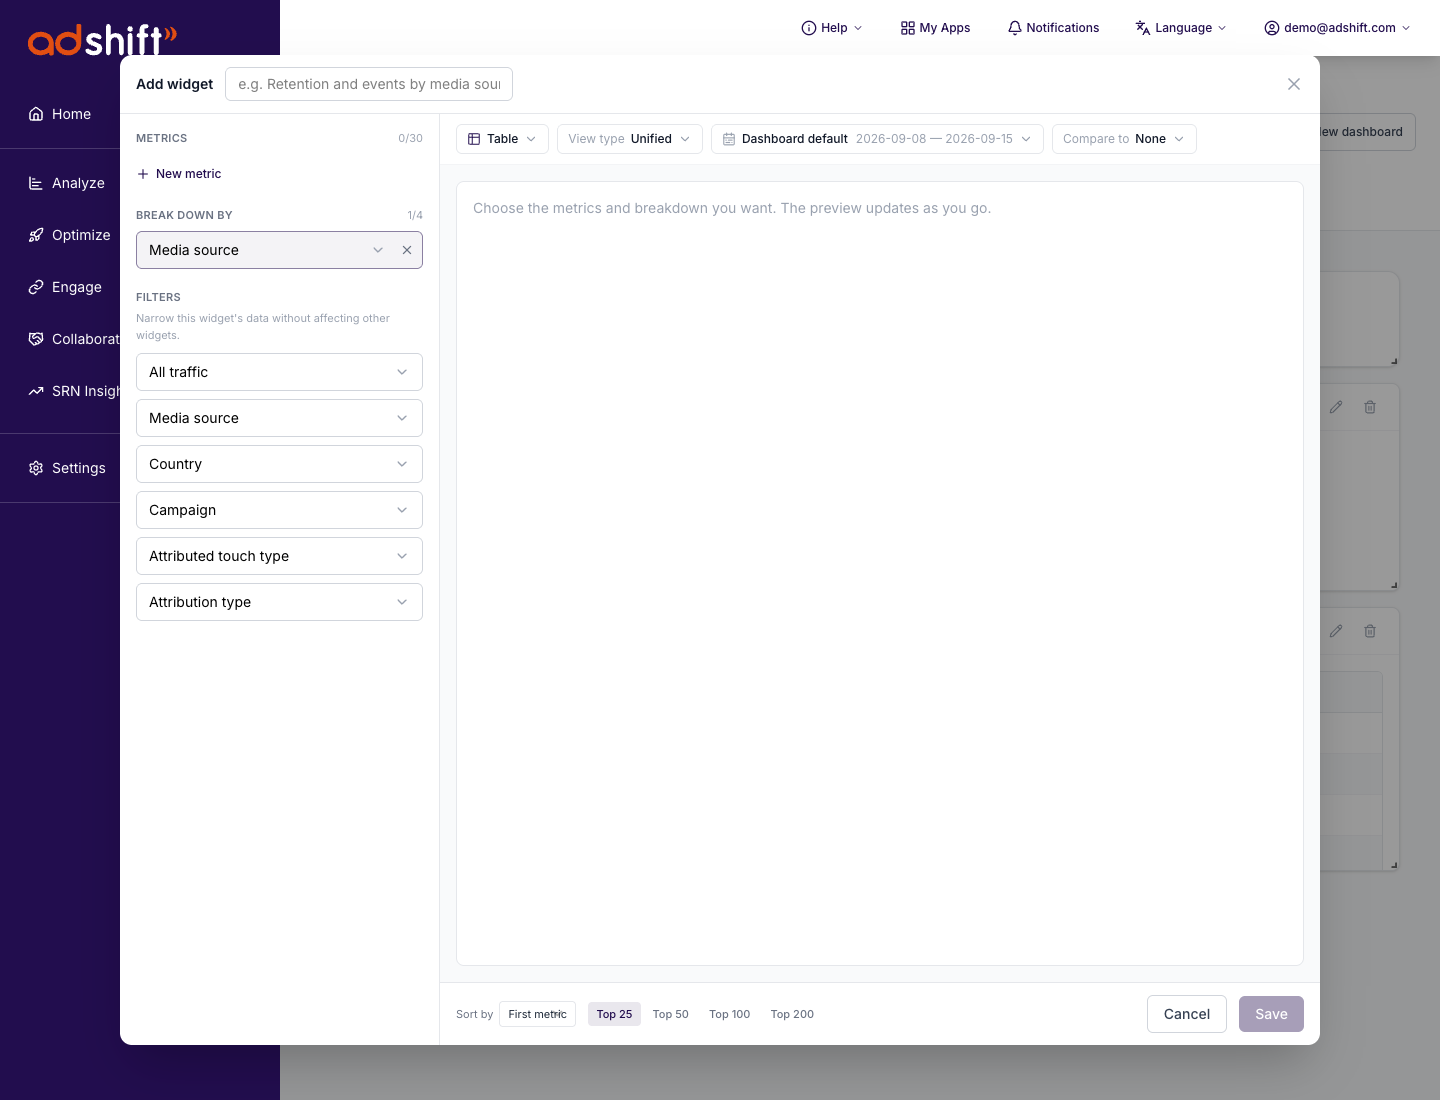
Click Add widget to open the widget editor.
Each widget has three main parts:
- Metrics: the numbers you want to measure, such as revenue, installs, events, CTR, sessions, or retention.
- Break down by: the dimension used to split the result, such as media source, campaign, country, ad, or date.
- Filters: widget-specific filters that narrow only this widget without changing the rest of the dashboard.
Choose metrics
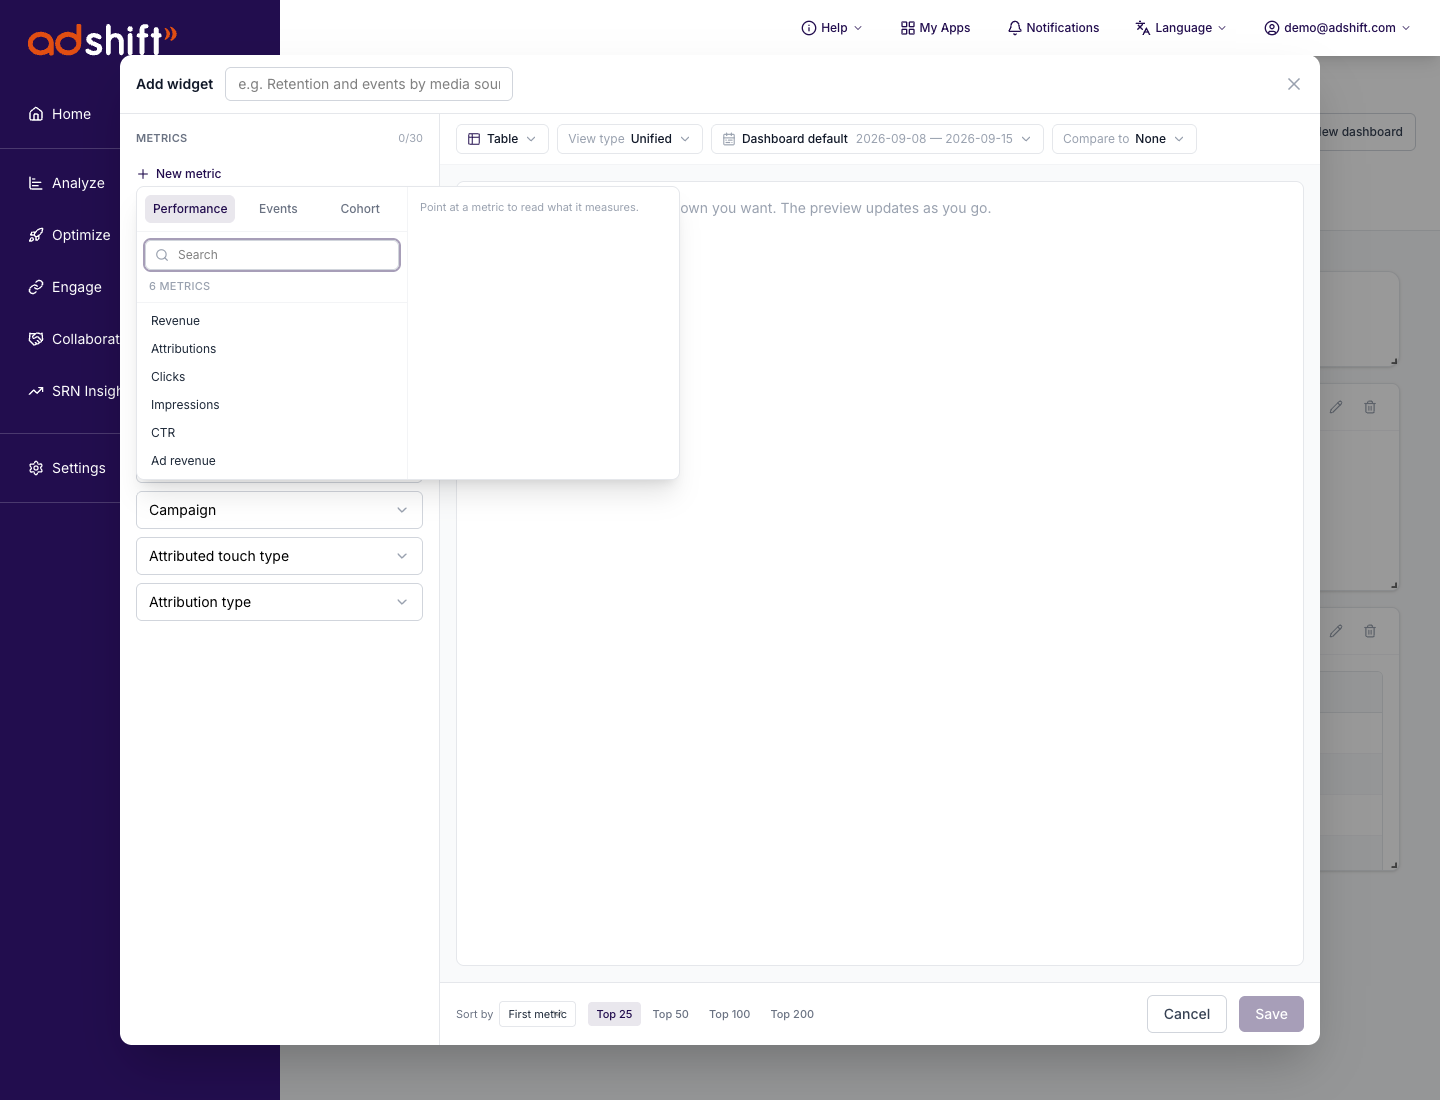
Click New metric to open the metric picker. Metrics are grouped into categories such as Performance, Events, and Cohort.
You can search for a metric or browse the list. Some metrics are unavailable for certain combinations of breakdowns, periods, or widget types. When that happens, AdShift keeps the widget visible and marks unsupported results as not applicable rather than hiding the configuration.
Pick a visualization
Custom Dashboards support several widget types:
| Widget type | Best for |
|---|---|
| Table | Detailed breakdowns and ranked rows |
| KPI | One or more high-level numbers |
| Line chart | Trends over time |
| Column chart | Time-based comparisons |
| Stacked area | Contribution over time |
| Horizontal bar | Ranked categories |
| Donut | Share-of-total views |
| Combo chart | Comparing metrics with different scales |
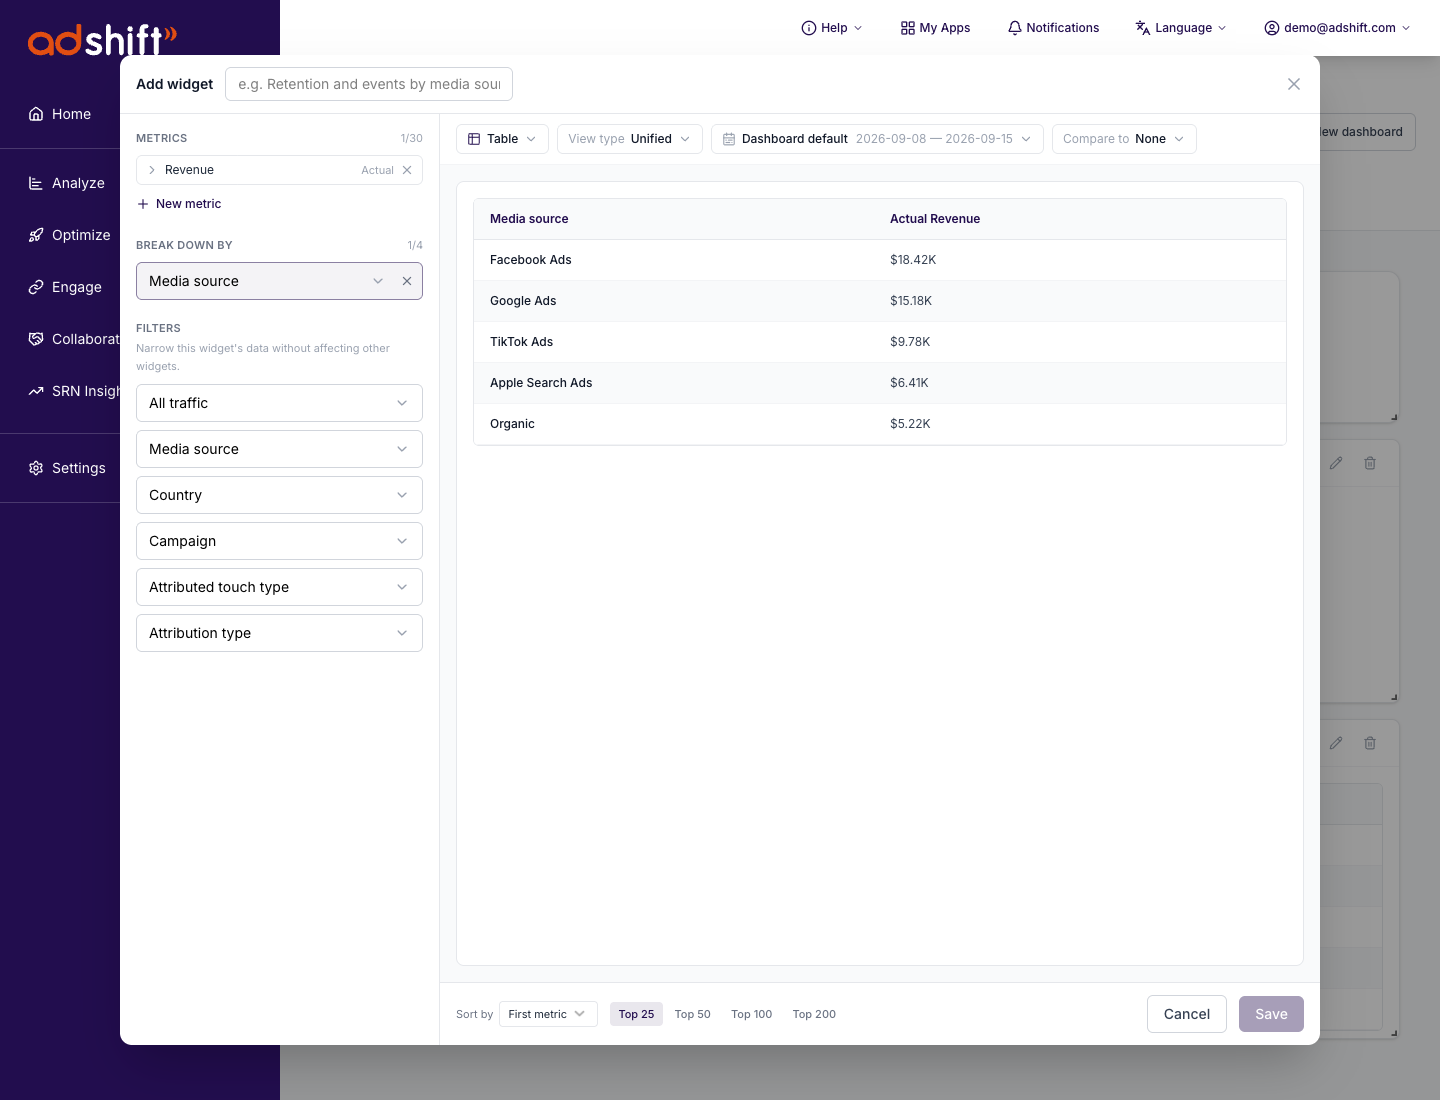
The preview updates while you configure the widget, so you can validate the result before saving.
Use widget-level filters
Widget filters are useful when one dashboard should contain several related views, for example:
- Total revenue across all traffic.
- Organic revenue only.
- Non-organic revenue only.
- A specific media source or campaign.
- A specific country.
- Specific attribution or touch types.
- A specific ad set or ad.
The filter applies only to the widget being edited. Other widgets on the same dashboard keep their own settings.
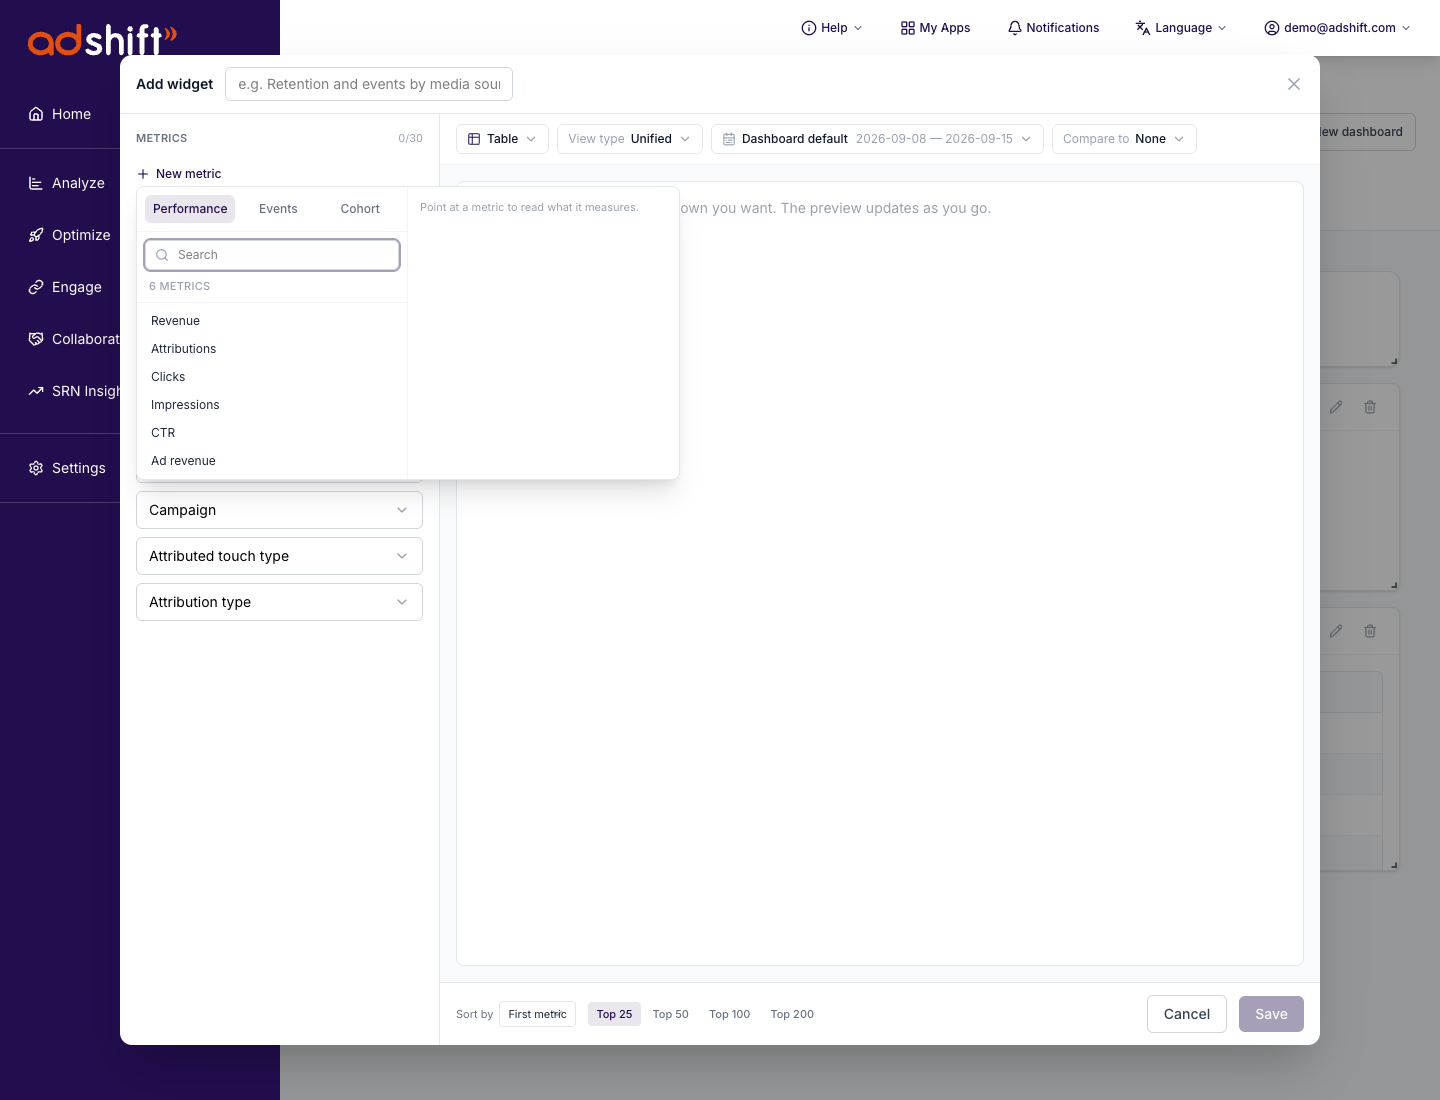
Available widget filters include:
- Traffic type: All traffic, Organic only, Non-organic only.
- Media source.
- Country.
- Campaign.
- Channel, when available.
- Attributed touch type.
- Attribution type.
- Ad set, when ad-level data is available.
- Ad, when ad-level data is available.
Compare periods
Tables and KPI widgets can compare the current date range against another period. Use Compare to in the widget toolbar to choose a comparison mode.
Use comparisons when you want to answer questions like:
- How did this week compare with the previous week?
- Did revenue improve after a campaign change?
- Which media sources gained or lost share?
Charts already show movement over time, so comparison controls are focused on tables and KPI tiles.
Save and arrange widgets
When the widget has a title and at least one metric, click Save.
After saving, you can:
- Drag widgets to rearrange the layout.
- Resize widgets to give important charts more space.
- Edit a widget to change its metrics, filters, visualization, or date range.
- Delete widgets that are no longer useful.
- Expand a widget for a larger view.
Share a dashboard
Click Share to control who can access a dashboard.
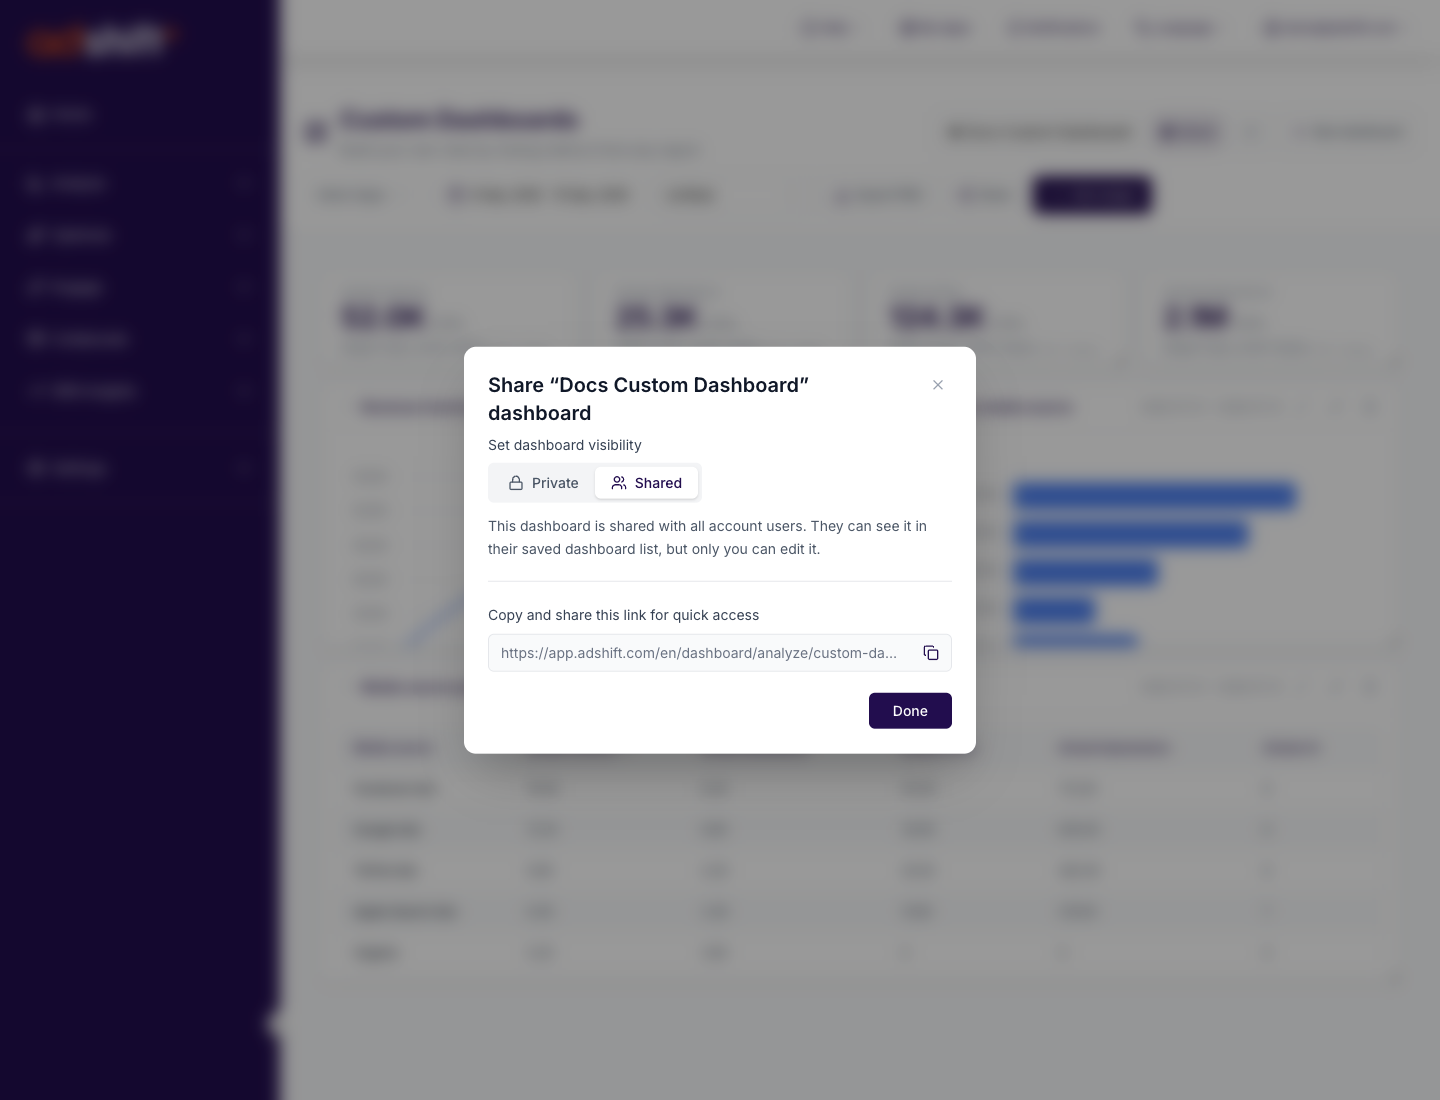
There are two visibility options:
- Private: only you can see the dashboard. The link works only for your account.
- Shared: other users in the same project can open the dashboard from the shared link and see it in their dashboard list.
The share modal also gives you a direct dashboard URL. Copy this link when you want someone to open the same saved dashboard immediately.
When changing a dashboard from Private to Shared, you can choose whether to notify project users.
Recommended dashboard ideas
Executive overview
Use a small set of KPI tiles and one trend chart:
- Revenue.
- Installs.
- ROAS or ROI, when available.
- Ad revenue.
- Sessions.
- Top media sources by revenue.
UA performance
Use table and chart widgets grouped by campaign, media source, ad set, or ad:
- Impressions.
- Clicks.
- Attributions.
- CTR.
- IPM.
- Revenue.
- Non-organic installs.
Monetization dashboard
Use revenue-focused metrics:
- IAP revenue.
- Ad revenue.
- Subscription revenue.
- ARPU.
- Revenue by media source.
- Revenue by country.
Retention and events dashboard
Use cohort and event metrics:
- Retention.
- Sessions.
- Active devices.
- Loyal users.
- Key funnel events.
- Event conversion rates.
Best practices
- Start with one clear question per dashboard.
- Use global date range and app selection for the dashboard's main scope.
- Use widget filters only when a widget needs to answer a narrower question.
- Prefer tables for diagnostics and charts for trends.
- Use KPI tiles for numbers stakeholders check frequently.
- Name dashboards and widgets clearly, so shared dashboards are easy to understand.
- Keep dashboards focused. If a dashboard becomes too large, split it into a new one.
FAQ
Can I create more than one custom dashboard?
Yes. You can create multiple dashboards and use the selector at the top of the page to switch between them.
Can I share a dashboard with my team?
Yes. Set the dashboard visibility to Shared and copy the dashboard link. Users must belong to the same project to access it.
Can I keep a dashboard private?
Yes. Keep visibility set to Private. A private dashboard is visible only to its owner.
Do widget filters affect the whole dashboard?
No. Widget filters affect only the widget where they are configured. Global app, date range, and view type controls define the default dashboard scope.
Why do some metrics show as unavailable?
Some metrics require a specific data source, attribution mode, period, or breakdown. If a metric is not compatible with the current widget configuration, AdShift marks it as unavailable instead of returning misleading values.
Can I export a dashboard?
Yes. When a dashboard has widgets, use the export option to download the visible dashboard view as a PNG.
Overview – Main Dashboard
Your daily marketing pulse: see spend, installs, revenue and ROAS across every channel and app in one place — with comparison charts, a drill-down table, and shortcuts into the detail.
Marketplace dashboard
How buyers find sellers, where they drop off and what brings them back - every card of the Marketplace dashboard explained in plain words, with examples and what to do next.