

Marketplace dashboard
How buyers find sellers, where they drop off and what brings them back - every card of the Marketplace dashboard explained in plain words, with examples and what to do next.
The Marketplace dashboard (Analyze → Marketplace) is for apps where buyers meet sellers. Some of your sellers sell inside the app: the buyer adds products to the cart and pays. Others are reached directly: the buyer calls them, opens directions to them or writes to them in a chat.
The dashboard helps you answer four everyday questions:
- How do people buy? In the app, or by contacting a seller directly?
- Do new users find what they came for? And where do the ones who never buy give up?
- Do buyers come back? And which sellers need help to sell more?
- What do people look for, and where? Including the things they search for but cannot find.
Five things to know first
These five ideas appear on almost every card. Once they are clear, the rest of the dashboard is easy to read.
1. We count people, not clicks. If one person opens the same seller's profile ten times, that is 1 viewer, not 10. So "350 viewers" means 350 different people.
2. Percentages always say "out of whom". "Bought: 2%" means 2 out of every 100 people in that group bought something. Each card says what the group is - for example "active users" or "new users with a full first week".
3. "Median" = the typical person. Line everyone up from fastest to slowest and take the person in the middle. "Median time to first purchase: 30 min" means half of the buyers bought within 30 minutes, half took longer. It ignores the few extreme cases that would distort an average.
4. "Full window" = everyone had the same chance. Some numbers look at what people did in their first 7 days, or within 30 days of their first order. Someone who installed the app yesterday has not had 7 days yet, so they are left out of that number until they have. Otherwise every recent date range would look worse than it really is.
5. Grey numbers = too few people to trust. "50% bought" sounds great, but if it is 1 person out of 2, it means nothing. Numbers based on very few people are shown in grey. Look at them, but do not make decisions on them.
Before you start
- Availability. The dashboard is part of the Marketplace add-on. If you do not see Marketplace under Analyze, it is not on your plan yet - contact us.
- Your app has to send the marketplace events. The dashboard is built only from them (the list is at the end of this article). If they are missing, the cards say No marketplace data.
- Data is updated once a night. By default you see the last 14 full days. Today is not shown, because it would only contain the first few hours and look like a sudden drop.
Filters at the top

| Filter | What it does |
|---|---|
| Apps | Choose the apps to look at. To see iOS and Android together, select both - their numbers are added up. |
| Date range | The days you want to look at. |
| Role | Show only buyers, only sellers, or people who are both (as your app reports them). |
| Membership | Show only members of your loyalty or paid programme, or only non-members. |
Role and Membership work on every card except Demand by region.
Customer paths
In-app purchase vs direct contact
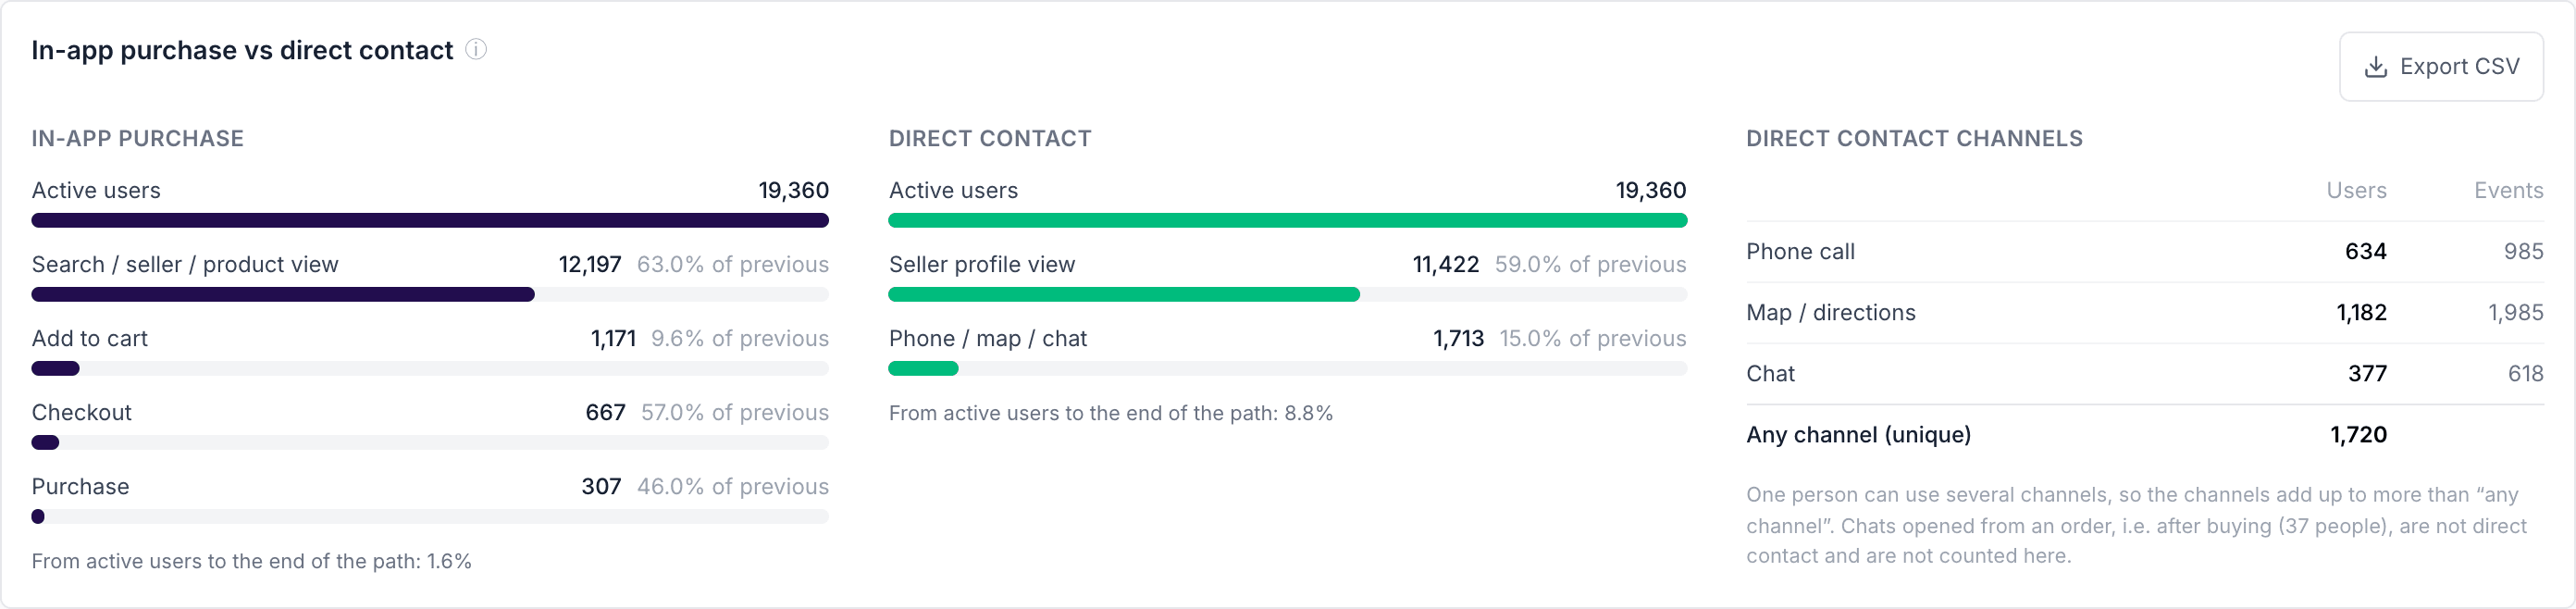
What it answers: how many people go all the way to a purchase in the app, how many contact a seller directly instead, and on which step most of them stop.
How to read it: there are two paths next to each other.
- In-app purchase: active users → looked at something (a search, a seller or a product) → added to cart → started checkout → bought.
- Direct contact: active users → opened a seller's profile → called, opened the map or started a chat.
Each step shows how many people got there and what share of the previous step that is. Example: 2,000 people added something to the cart and 1,100 of them started checkout - that is 55% of the previous step. The biggest drop between two steps is the first place to look.
The Direct contact channels table shows how many people used each channel. One person can both call and open the map, so the channels added together are more than Any channel (unique), which counts each person once.
What to do with it:
- A big drop between cart and checkout often points to delivery costs, minimum order values or a confusing checkout.
- A big drop between checkout and purchase often points to payment problems.
- Many direct contacts compared with in-app purchases means many buyers prefer to talk to the seller. Consider which of those sellers could start selling in the app.
Watch out: a chat that the buyer opens from an order they already placed (for example to ask about delivery) is not counted as a direct contact. It is shown separately under the table.
Buyers and contacting people per day
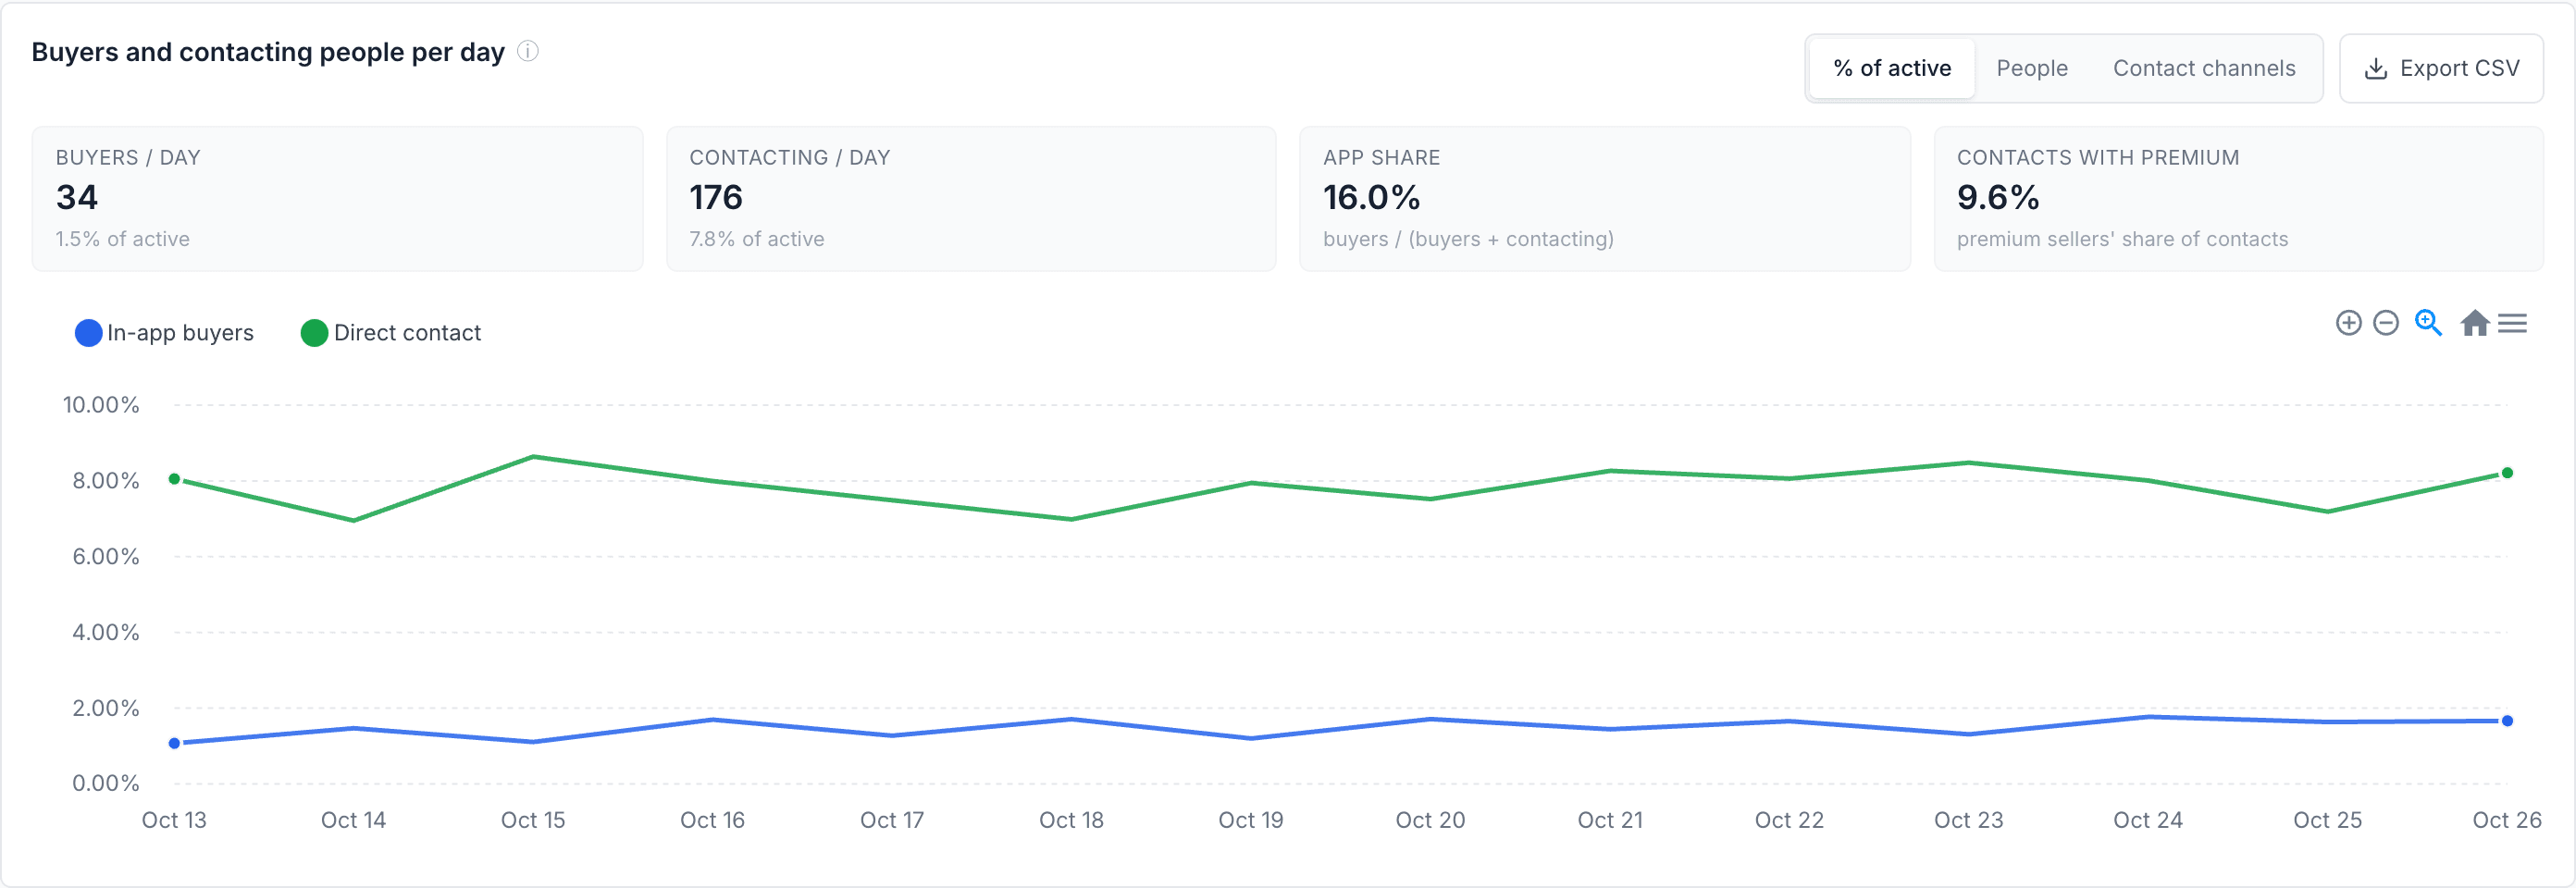
What it answers: is buying in the app growing compared with contacting sellers directly?
How to read it: two lines per day - people who bought in the app, and people who contacted a seller. Three views:
- % of active - out of everyone who used the app that day. Use this one to see whether behaviour changes. A busy weekend raises every number, but it does not raise the percentage.
- People - plain numbers of people.
- Contact channels - the contact line split into phone, map and chat.
The four tiles above the chart:
| Tile | In plain words |
|---|---|
| Buyers / day | How many people buy in the app on an average day. |
| Contacting / day | How many people contact a seller directly on an average day. |
| App share | Out of everyone who wanted to buy (bought in the app or contacted a seller), how many did it in the app. Example: 50 buyers and 250 contacting people → 50 / 300 = 17%. |
| Contacts with premium | What share of direct contacts goes to premium sellers - the ones who also sell in the app. |
What to do with it: if App share grows month after month, more buying is moving into the app. If it falls, find out why buyers prefer to call.
New users & drop-off
New users: time to value and drop-off
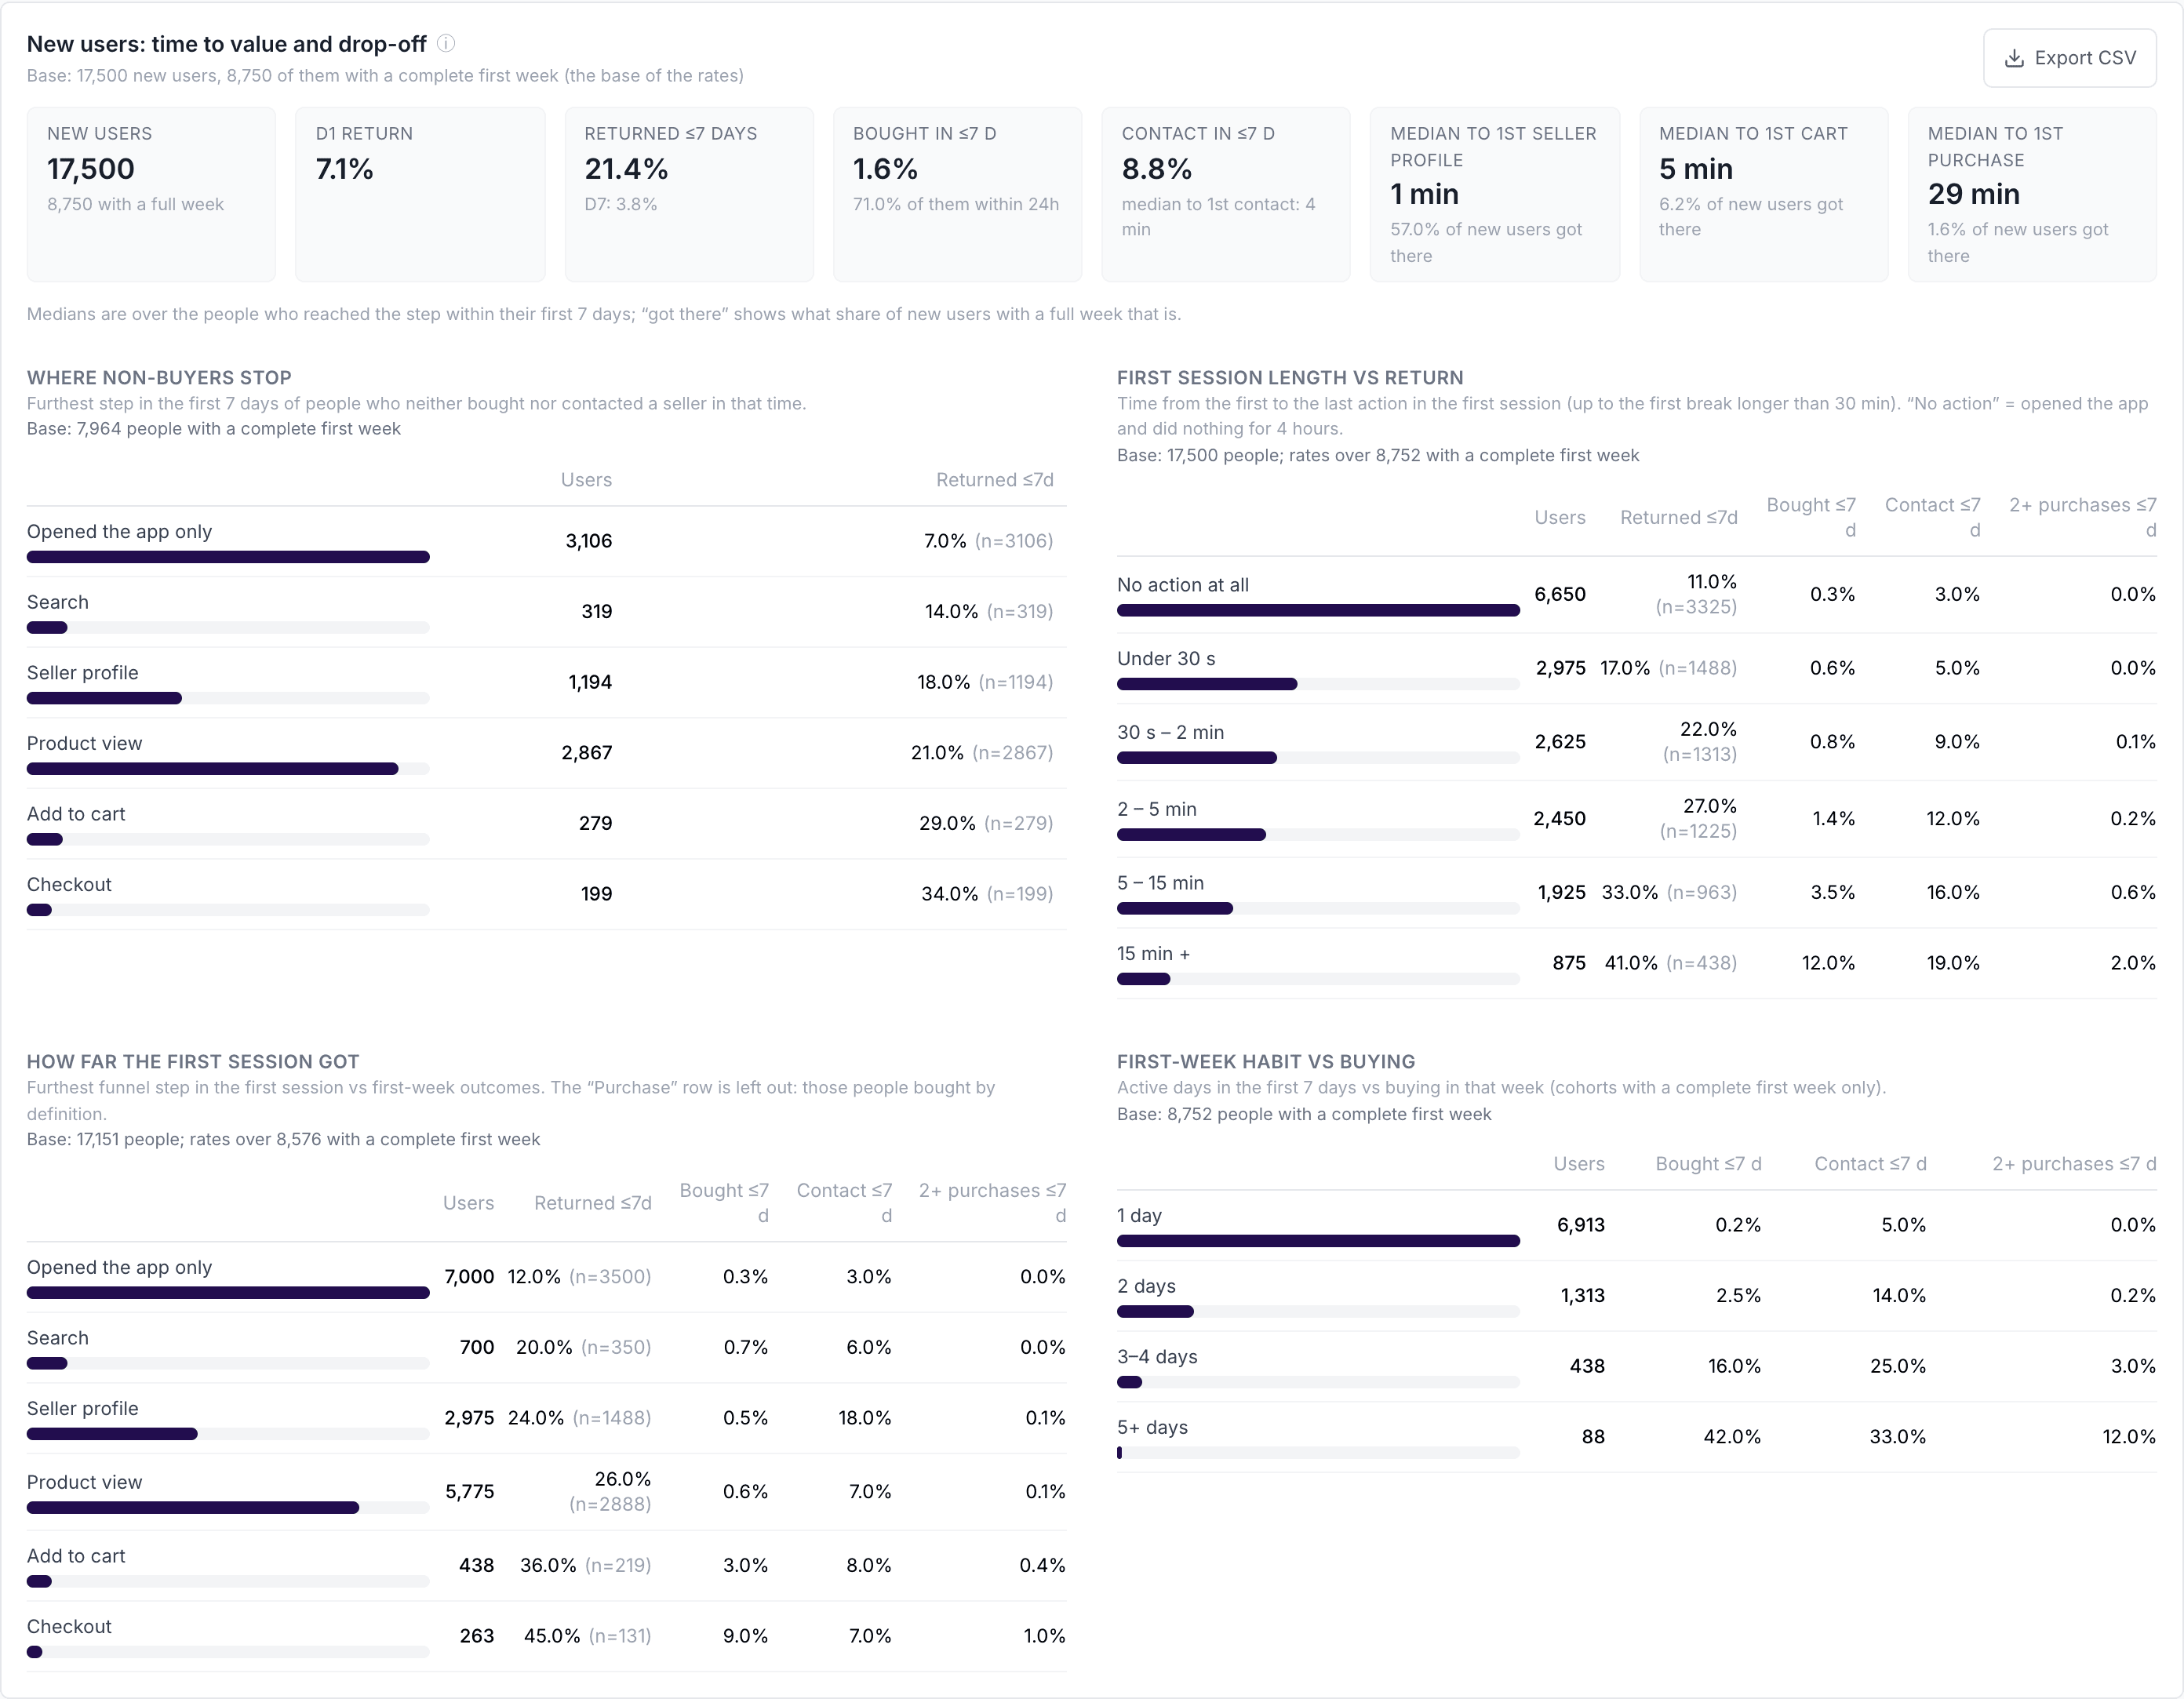
What it answers: do people who just installed the app quickly find what they came for - and if not, where do they give up?
Who is counted: people who used the app for the first time in the chosen date range. Everything is about their first 7 days, and only people who have already had those 7 days are counted (see Full window above). The card always says how many people that is, for example: "1,000 new users, 600 of them with a full first week". The percentages are out of those 600.
The tiles:
| Tile | In plain words |
|---|---|
| D1 return | Out of 100 new users, how many came back the next day. |
| Returned ≤7 days | How many came back at least once in their first week. Below it, D7: how many came back exactly on day 7. |
| Bought in ≤7 d | How many bought in the app in their first week. Below it: how many of those buyers bought already in their first 24 hours. |
| Contact in ≤7 d | How many called, opened the map or chatted with a seller in their first week. |
Time to value: how long it takes a typical new user (the median) to open a seller's profile for the first time, add the first product to the cart, buy for the first time and contact a seller for the first time - counted among the people who got there in their first week. Next to each time you see got there: what share of new users reached that step at all.
Always read the two together. Example: "Median to 1st purchase: 30 min, got there: 1%" means that the few people who buy do it quickly, but 99 out of 100 new users never buy in their first week. The problem is not speed - it is that most people never get that far.
The four tables compare groups of new users, and for each group show how many came back, bought, contacted a seller, and bought twice in their first week:
- First session length vs return - groups by how long the very first visit lasted. Usually, the longer the first visit, the more likely people are to come back and buy.
- How far the first session got - groups by the furthest step reached in the very first visit (only opened the app, searched, viewed a seller, a product, the cart, checkout).
- Where non-buyers stop - only people who neither bought nor contacted anyone in their first week, grouped by the furthest step they reached. This is the most useful table for finding problems.
- First-week habit vs buying - groups by how many days of the first week people used the app (1, 2, 3-4, 5+).
What to do with it:
- If most non-buyers stop at Product view, people look but do not add to cart: check prices, photos, stock and delivery information.
- If many stop at Opened the app only, people do not know where to start: look at the home screen and onboarding.
- If people who come back on 3 or more days buy much more often, it is worth bringing new users back in their first week, for example with a push notification or an e-mail.
Watch out: "first session" means the first visit, up to the first break longer than 30 minutes. We do not use the phone's own session, because paying usually sends people to their bank app and back, which would split one visit into two.
Repeat purchases & sellers
Second purchase
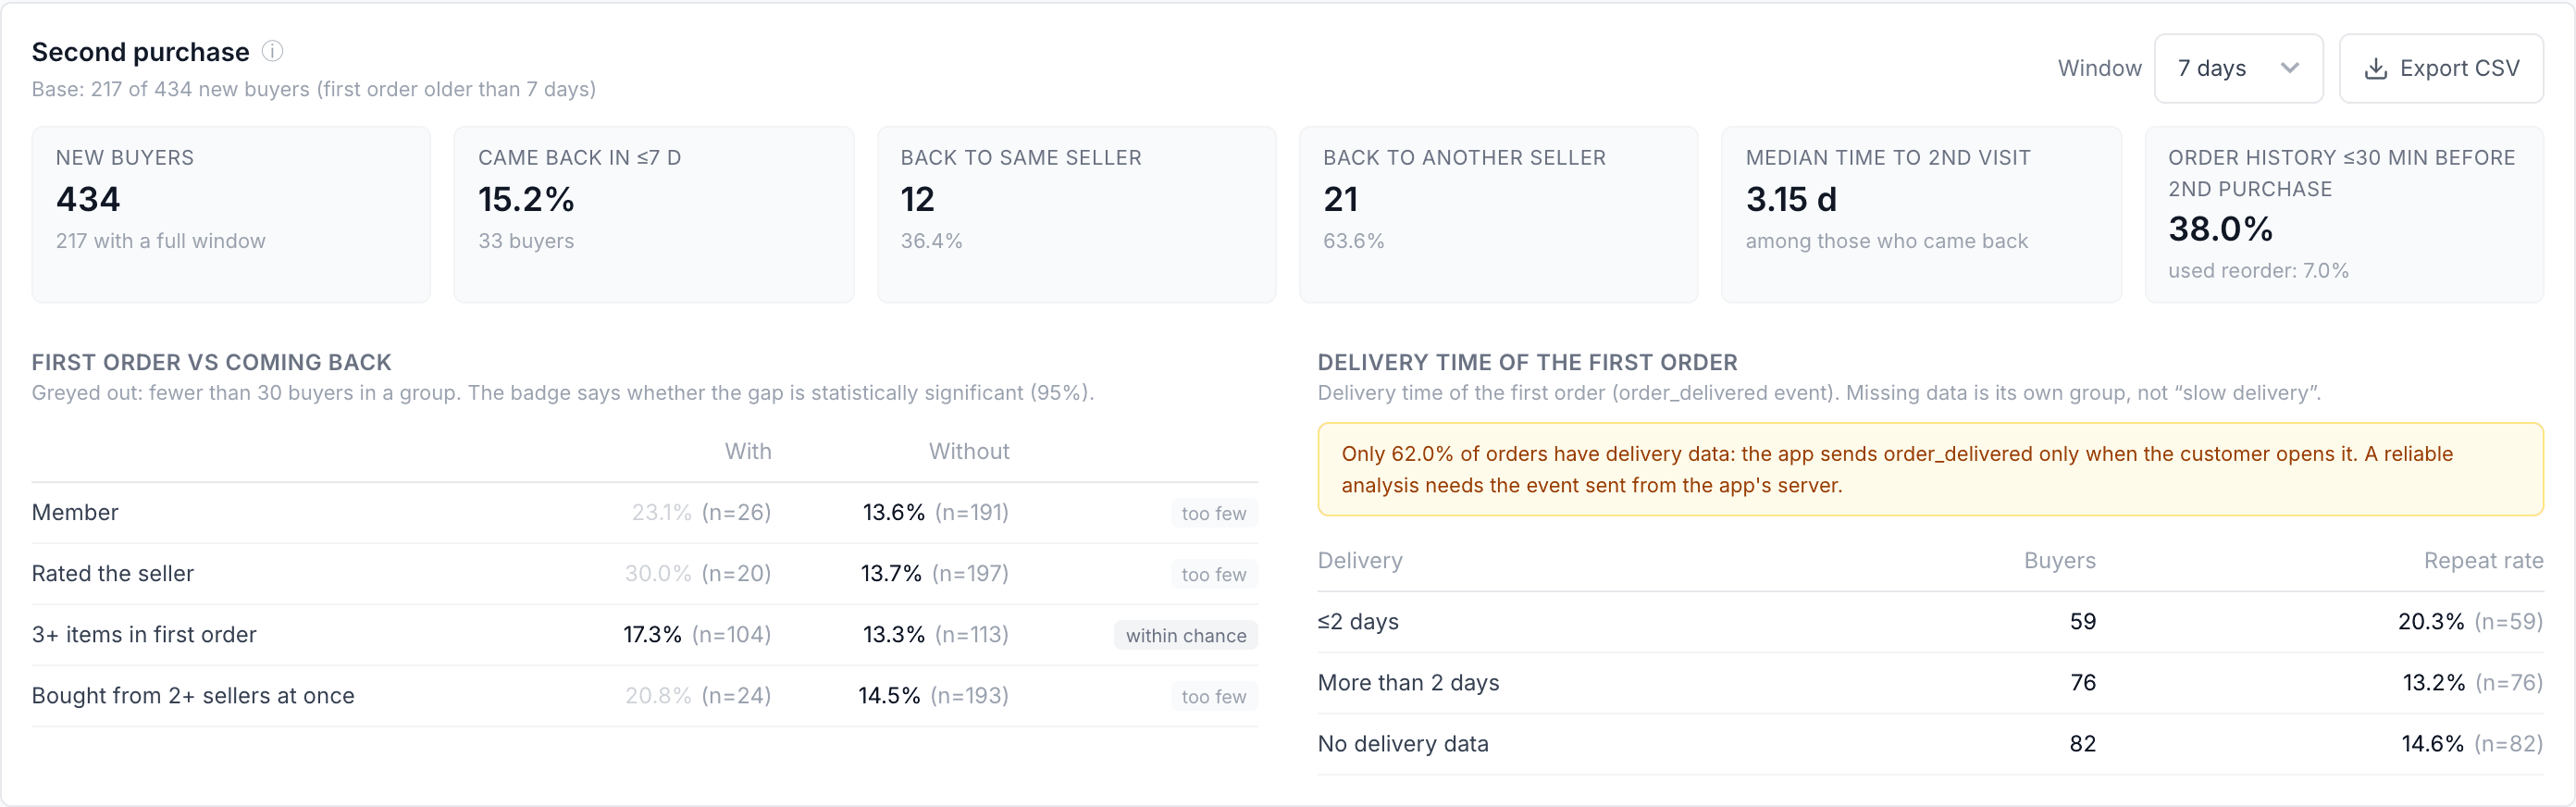
What it answers: out of people who bought for the first time, how many come back to buy again, and what makes them come back?
How to read it: choose a Window - 7, 14 or 30 days. Example: with a 30-day window, the card looks at people whose first order is in your date range and asks: did they buy again within 30 days of that first order? Only people whose first order is at least 30 days old are counted, so everyone had the full 30 days (see Full window). If nobody qualifies yet, the card says so - pick a shorter window or an earlier date range.
Buying from three sellers in one trip creates three orders, but it is still one shopping trip. Coming back means a new trip on another occasion.
- Came back - how many bought again, split into back to the same seller and back to another seller, and the typical number of days until the second purchase.
- Order history ≤30 min before 2nd purchase - how many of the returning buyers looked at their previous orders just before buying again, and how many used reorder. It shows whether these shortcuts help people buy again.
- First order vs coming back - compares people with and without something in their first order: being a member, rating the seller, buying 3 or more products, buying from 2 or more sellers at once. Example: "Rated the seller: 25% came back, did not rate: 12%". The badge tells you whether the difference is significant - big enough and based on enough people to be real - or within chance, which means it could just be luck.
- Delivery time of the first order - how many came back after delivery in up to 2 days, in more than 2 days, and where we do not know the delivery time.
What to do with it: if people who received fast delivery come back much more often, delivery speed is worth investing in. If most returners go back to the same seller, a good first experience with a seller is what builds loyalty.
Watch out: the delivery comparison is only as good as the delivery data. The card shows how many orders have it; if it is a small share, treat that part as a hint, not a conclusion.
Top sellers
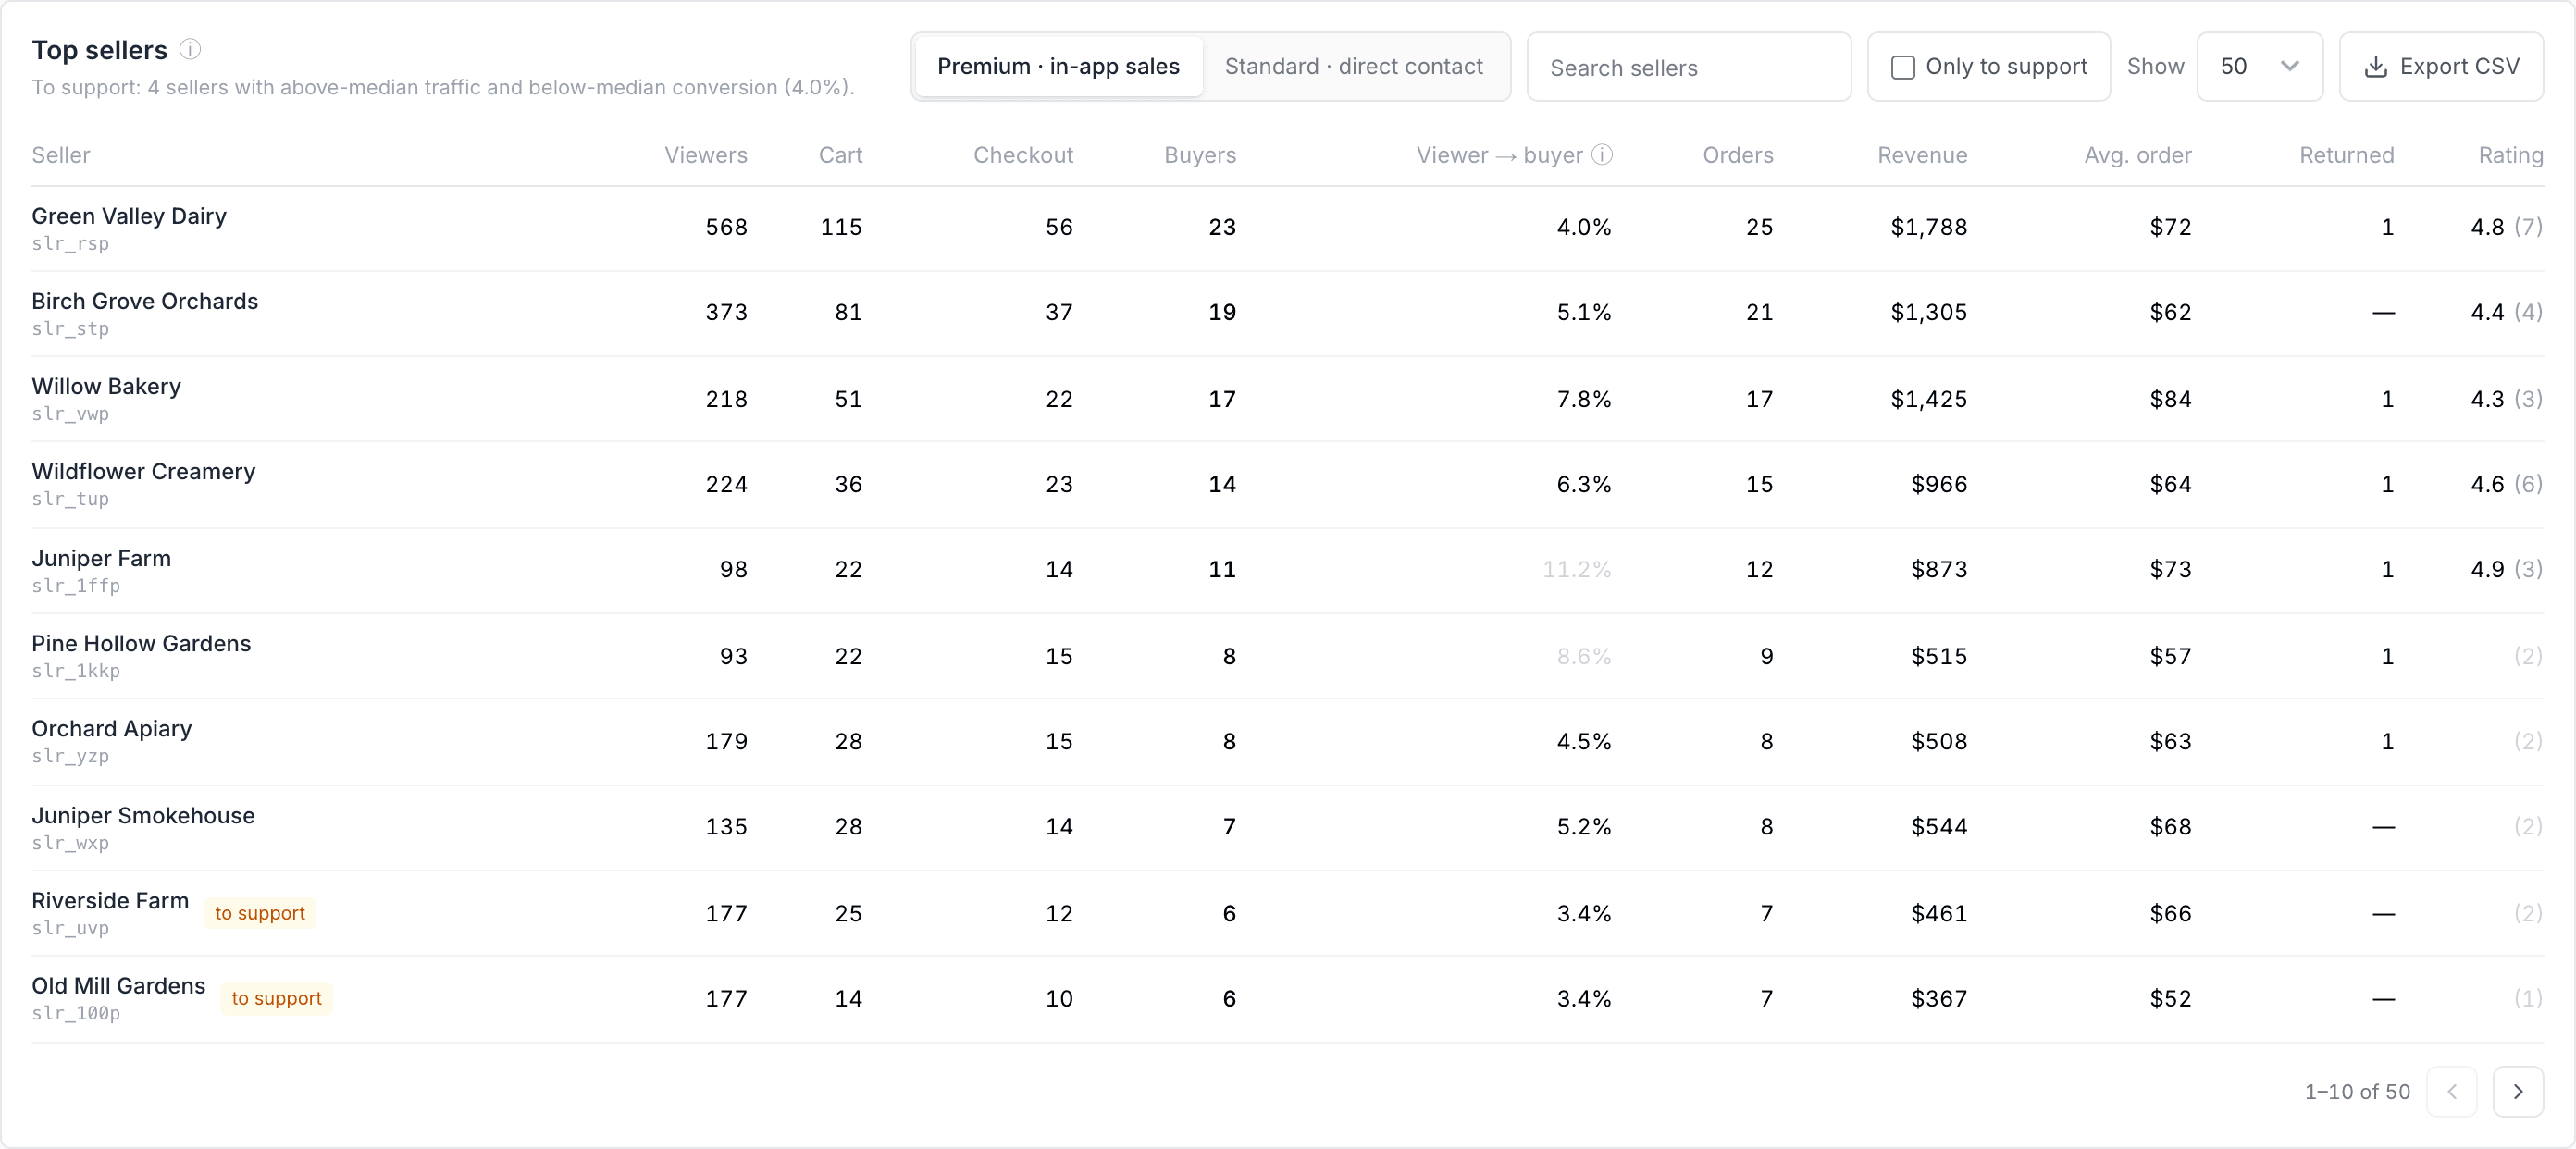
What it answers: which sellers get the most attention, which turn it into sales, and which have visitors but do not sell?
There are two tabs, because the two kinds of sellers are measured differently:
- Premium · in-app sales - sellers who sell in the app. You see how many people viewed the seller's profile, added to cart, started checkout and bought, the share of viewers who bought (viewer → buyer), orders, revenue, average order value, buyers who came back, and the rating.
- Standard · direct contact - sellers who are contacted directly. You see how many people viewed the profile, how many contacted the seller (viewer → contact), and whether by phone, map or chat.
Example: a seller with 400 viewers and 20 buyers has a viewer → buyer rate of 5%: 1 in 20 people who looked at the profile bought.
- To support marks sellers who get more visitors than most but convert fewer of them than most. People are interested, but something stops them - often price, photos, product descriptions or stock. These are good sellers to talk to first. Tick Only to support to see just them.
- Conversion is grey when a seller has had too few visitors to judge fairly (fewer than 100 for premium, fewer than 30 for standard).
- The rating shows how many ratings it is based on, for example 4.8 (12). It is hidden when there are fewer than 3.
- Sellers are shown by their ID until we receive a list matching IDs to seller names. You can search by ID or name.
Demand by region
What people look for, and where
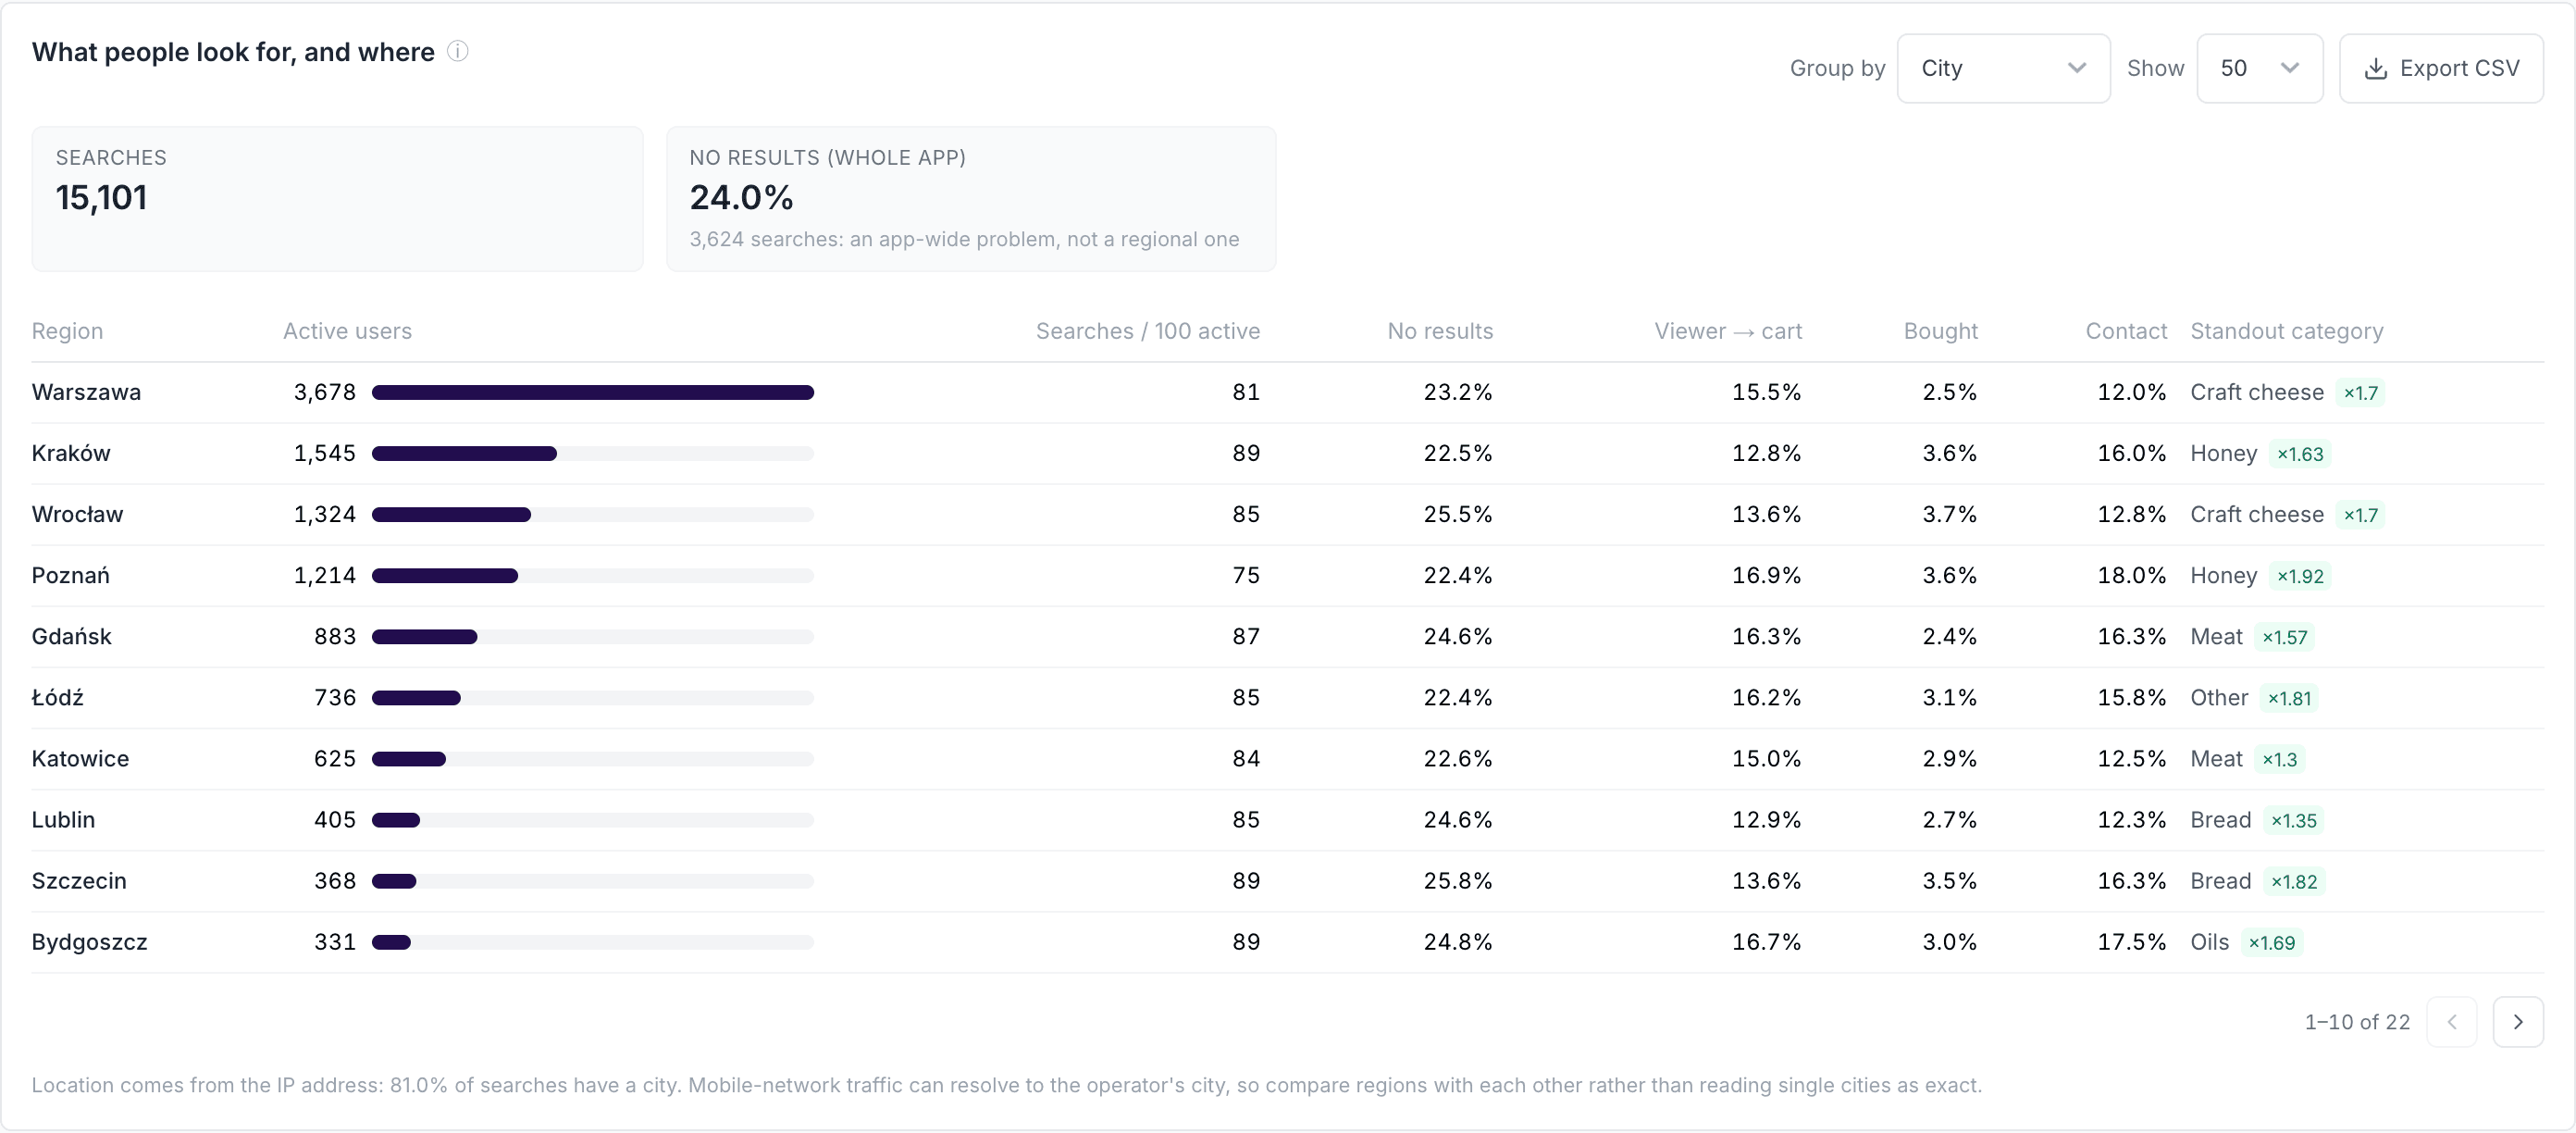
What it answers: in which cities or regions your app is used, how actively people there search, and how often that ends in a purchase or a contact.
How to read it: one row per city (or per voivodeship - switch with Group by), sorted by the number of active users.
| Column | In plain words |
|---|---|
| Active users | People whose activity comes mostly from this place. |
| Searches / 100 active | How many searches 100 people from this place make. It lets you compare a big city with a small one. |
| No results | Out of 100 searches here, how many found nothing. |
| Viewer → cart | Out of 100 people who viewed a product, how many added something to the cart. |
| Bought / Contact | Out of 100 active users here, how many bought in the app / contacted a seller. |
| Standout category | What people here are interested in more than elsewhere. ×1.30 means 30% more interest than the average across all places. |
Example: "Standout category: Honey ×1.80" next to a city means people there look at honey 80% more often than everyone else.
Click a row to see the categories and searches of that place in the cards below. Show all regions takes you back.
What to do with it: a place with many users but a low Bought rate may simply have too few sellers nearby. A standout category tells you which sellers to recruit there.
Watch out: location is estimated from the internet connection, not from GPS. People on mobile data are sometimes shown in the city of their mobile operator, and some activity has no location at all. Use it to compare places with each other, not as an exact address.
Categories
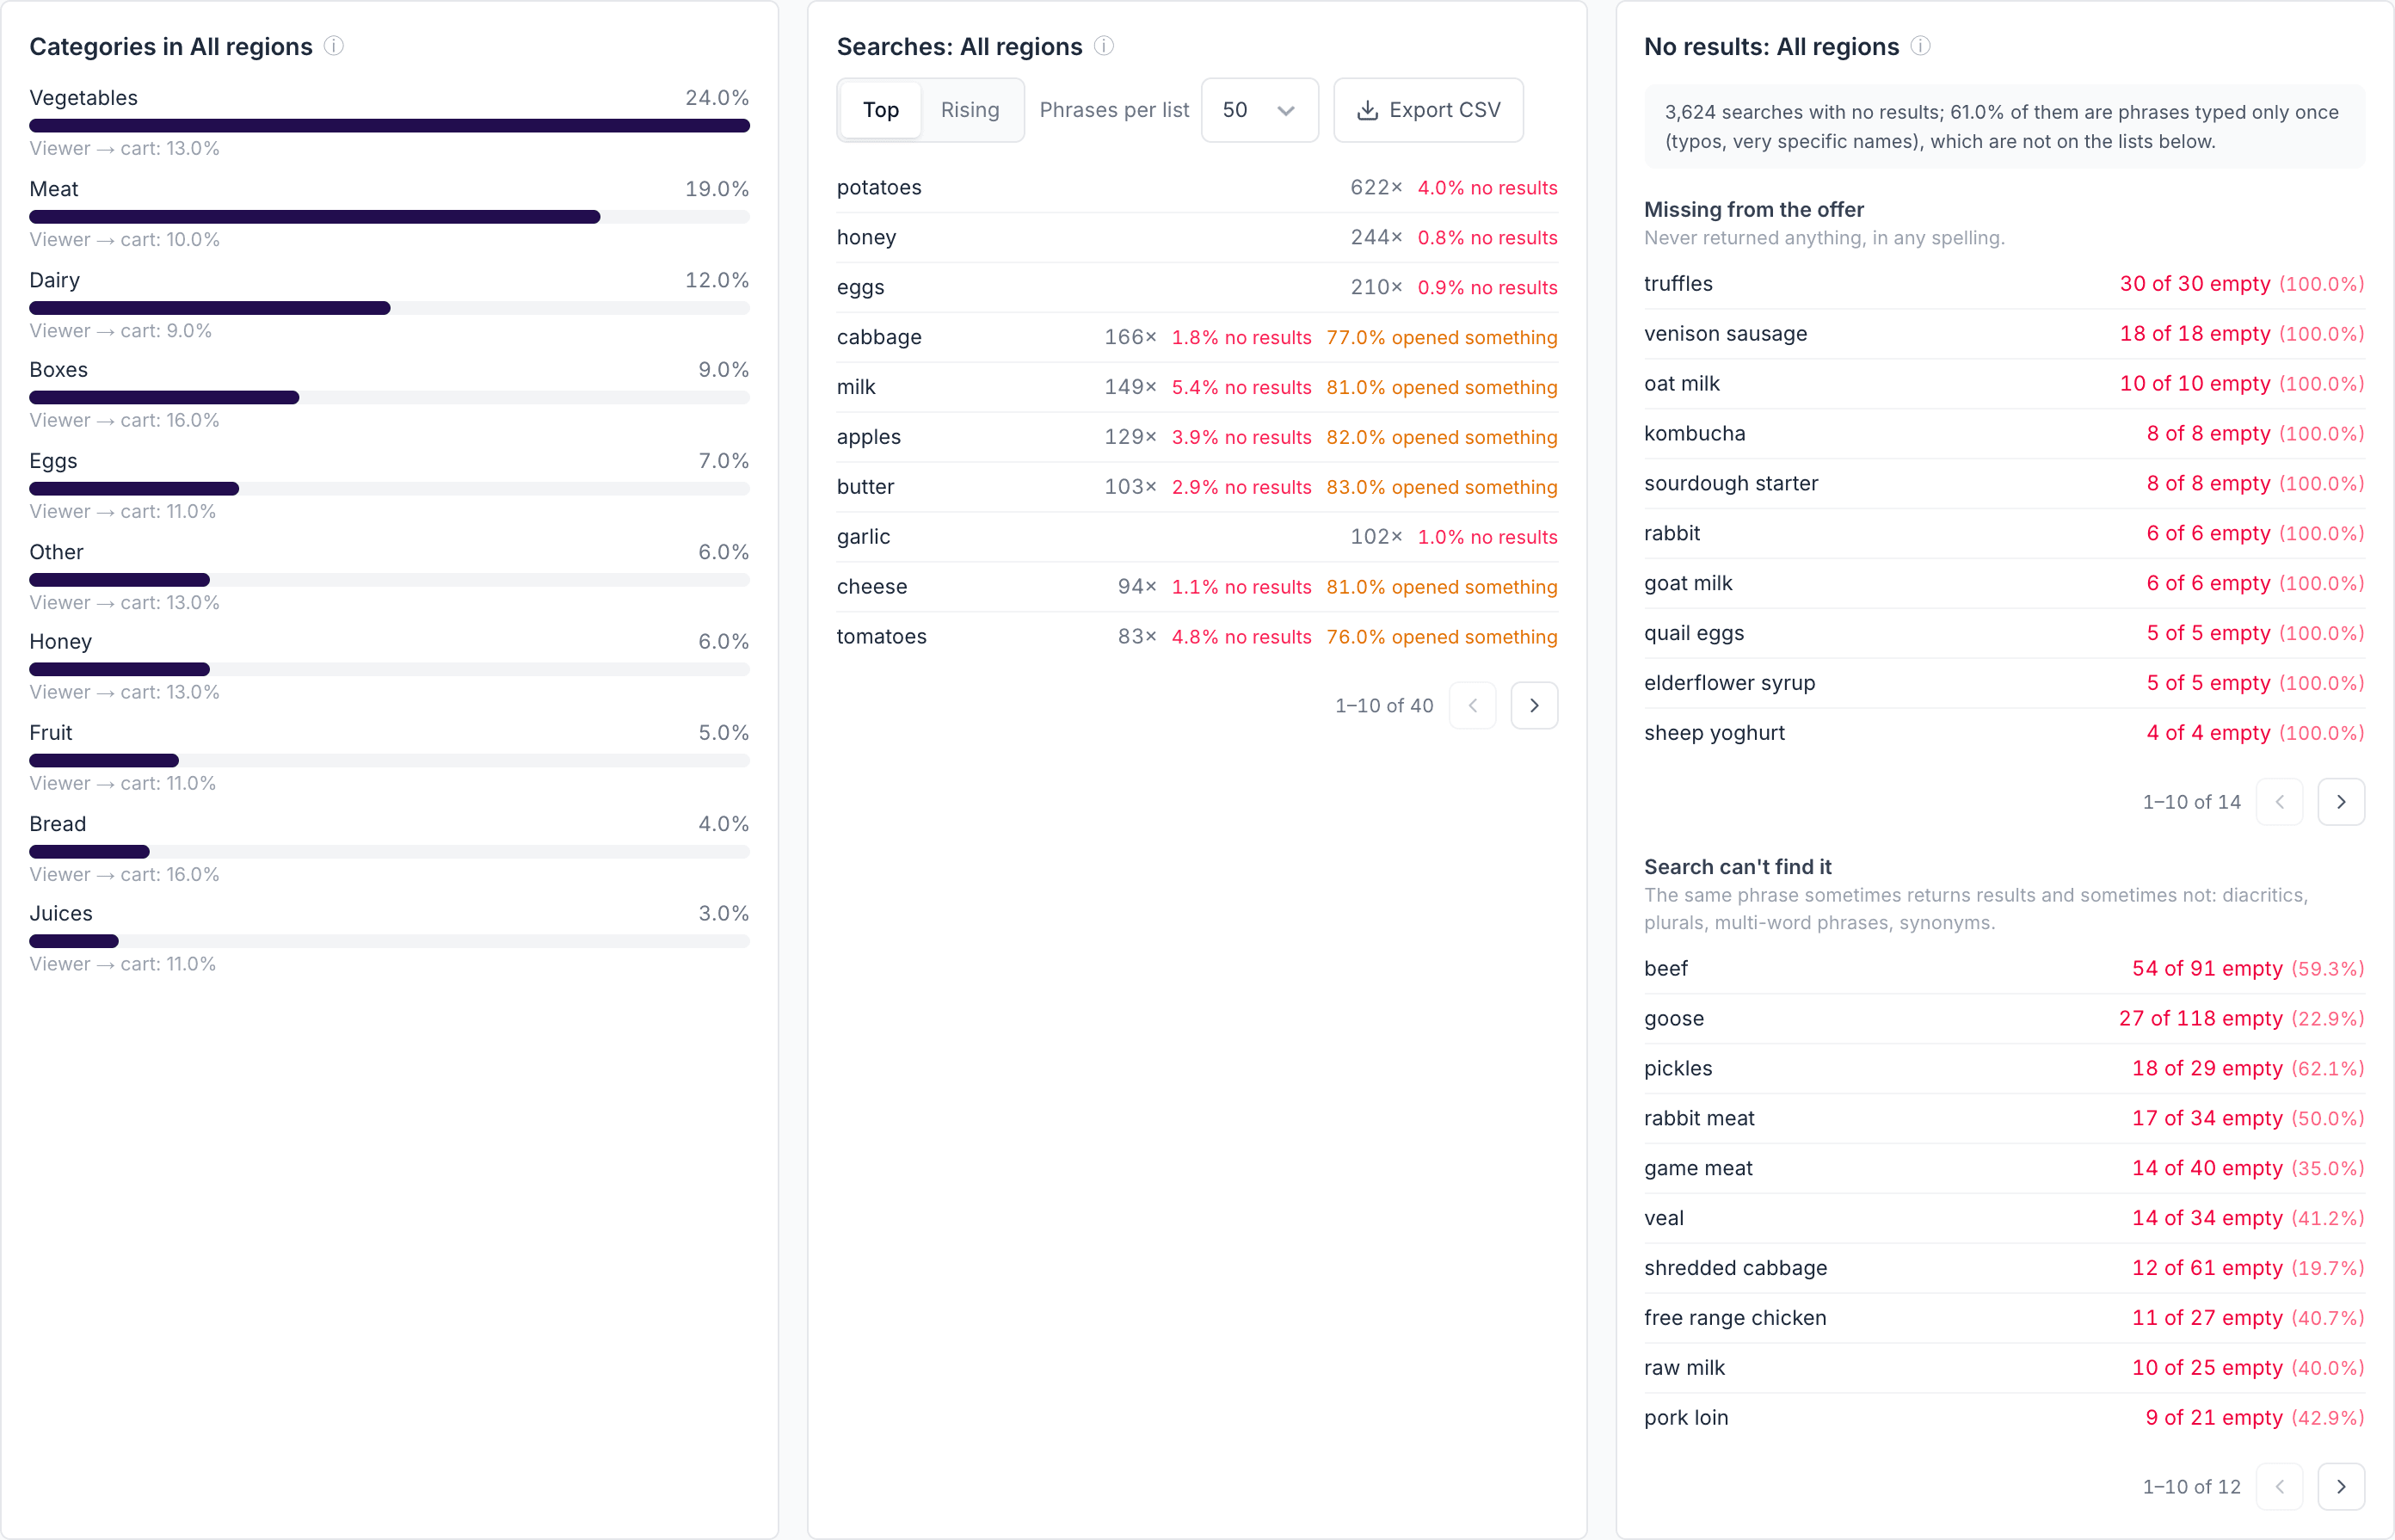
What share of all product views each category gets, and how often viewing turns into adding to cart. For a selected place, the index shows whether people there like the category more (above ×1) or less (below ×1) than average.
Searches
- Top - the phrases people search for most. Red shows how often a phrase found nothing. Orange shows phrases where fewer than 85 out of 100 searches led to opening a product, a seller or a contact - the search returns results, but not the ones people want.
- Rising - phrases that are growing clearly faster than searching in general, compared with the period of the same length just before. Good for spotting seasonal demand early, for example before a holiday.
No results
Phrases that found nothing at least twice, split into two lists, because each needs a different fix:
- Missing from the offer - the phrase never finds anything, in any spelling. Nobody sells it in the app yet: a ready list for recruiting new sellers or products. If the list contains place names - a city, a town, a district - people are not looking for a product but for sellers near them. The search does not handle locations, so they find nothing: that is a reason to add search or a filter by location, not to recruit sellers.
- Search can't find it - the same phrase sometimes finds results and sometimes does not. The product exists, but the search misses it because of missing accents, plural forms, longer phrases or different words for the same thing. Pass this list to the people who look after your app's search.
The line above the lists says how many searches with no results were phrases typed only once - mostly typos and very specific names. They are left off the lists because there is little to learn from them.
Lists, pages and export
Seller, region and search lists show 50 entries by default. Use Show (or Phrases per list) to switch to 10, 20, 50, 100 or 200, and the arrows under a list to move between pages of 10.
Every card has an Export CSV button. The file contains everything the list has loaded - not only the page you are looking at - and opens correctly in Excel.
How we count (for the curious)
- Funnel steps. A person counts on a step when they did that step and every step before it at some point in the date range - not necessarily in that exact order.
- Visits. Activity belongs to one visit until there is a break of more than 30 minutes. This is used for the first session and for second purchases.
- Significance. "Significant" means there is at most a 5% chance that the difference is just luck.
- Location. A person belongs to the city most of their activity comes from in the chosen date range.
What the dashboard needs from your app
The dashboard only reads these events. If an event is missing, the matching card stays empty; if a parameter is missing, the matching column stays empty. Your developers can use this table as a checklist.
| Event | Key parameters | Used for |
|---|---|---|
as_search |
as_search_string, results_count |
Searches, no-results lists, demand by region |
seller_view |
seller_id, seller_tier |
Seller profile views |
as_content_view |
category, seller_id |
Product views, categories |
as_add_to_cart |
category, seller_id |
Cart step |
as_initiated_checkout |
seller_id |
Checkout step |
as_purchase |
as_order_id, as_revenue, as_currency, seller_id, seller_tier, items_count |
Purchases, revenue, repeat purchases |
phone_click, map_open, chat_start |
seller_id, seller_tier, source |
Direct contact (source = order marks a chat about an existing order) |
order_delivered |
as_order_id, delivery_days |
Delivery time in Second purchase |
as_rate |
as_order_id, rated_object = seller, as_rating_value |
Seller ratings |
previous_order_viewed, reorder |
- | Order history and reorder before buying again |
Every event should also carry marketplace_role and plus_member - they power the Role and Membership filters.
Tip: send
order_deliveredfrom your server when an order is delivered. If the app only sends it when the customer opens the order, most orders end up without delivery data.
FAQ
Why do the contact channels add up to more than "Any channel"? One person can call a seller and also open the map. Each channel counts them once; "Any channel" counts them once in total.
Why are some numbers empty for the last few days? Numbers about the first 7 days, or about coming back within a window, need that time to pass first. Choose an earlier date range or a shorter window.
Why are the numbers different from Overview or Activity View? This dashboard counts people who used marketplace features, and only from marketplace events. Overview and Activity View count installs, sessions and all events.
Why do I see seller IDs instead of names? Your app's events only contain the seller ID. Send us a list matching seller IDs to names and the names will appear.
See also
- My dashboards — what each one is for - which Analyze dashboard answers which question
- Unique users - how AdShift counts people
Custom Dashboards
Custom Dashboards let you build your own analytics view in AdShift by combining metrics, dimensions, filters, charts, KPI tiles, and tables in one place.
SDK Information
See which app, SDK and OS versions your users are running, what devices they use, and how ATT consent is trending on iOS. The page to check before you drop support for an old version or ship a privacy change.