

Campaign payback by install cohort
Compare each campaign's install cohorts against their acquisition cost, see when they broke even, and separate unpaid cohorts from unknown or non-applicable spend.
Campaign payback shows whether each campaign cohort has earned back what it cost to acquire, and how many months it took to break even.
Use it when you want to judge campaign economics by acquisition month. Overview tells you what happened in a calendar period. The daily Cohort and retention table follows user behavior by cohort age. Payback asks a different question: "For users acquired by this campaign in this install month, has lifetime revenue to date covered the spend?"
Open Analyze -> Cohort & Retention, then select the Payback tab.
Use this view when you want to judge whether campaign cohorts earned back their acquisition cost, without mixing cohorts acquired in different months.
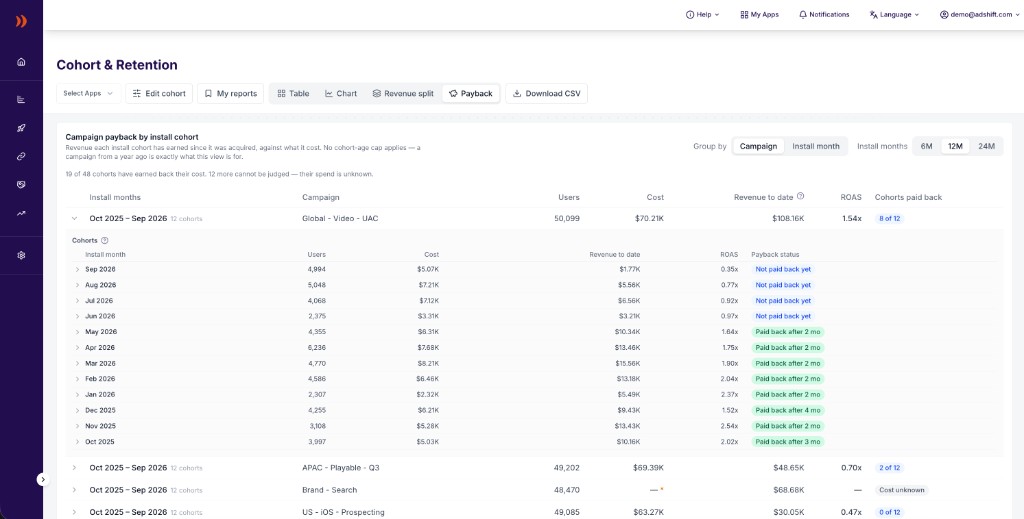
The Payback table defaults to Campaign grouping. Open a campaign to see each install cohort, then open a cohort to see its month-by-month revenue.
How to read this screen
Each row is one install month, app, and campaign. Read from left to right: who was acquired, what they cost, how much cohort-attributable revenue they have earned so far, and whether that revenue has covered the spend.
The most important column is Payback status. It separates cohorts that already broke even from cohorts that have not paid back yet, rows with missing spend, and organic rows where payback is not applicable.
The axis is install month, not revenue month
The month selector chooses which install months to evaluate: 6, 12, or 24 months, defaulting to 12.
Revenue is then accumulated from each cohort's install month through today. There is no cohort-age cap on this tab. A campaign from a year ago is exactly what Payback is for: enough time has passed to judge whether the users it acquired returned their cost.
This is the opposite of Revenue split:
- Revenue split chooses revenue months, then asks which install cohorts earned that revenue.
- Payback chooses install months, then follows those cohorts forward until today.
Two ways to group the table
Use Group by to choose the level you want to read first.
- Campaign is the default. It rolls install-month rows up into one campaign row, so you can answer: "Across the selected install months, how much did this campaign spend and earn in total?"
- Install month keeps one row per campaign in one install month. This is the safest way to judge payback, because every row contains users of the same age.
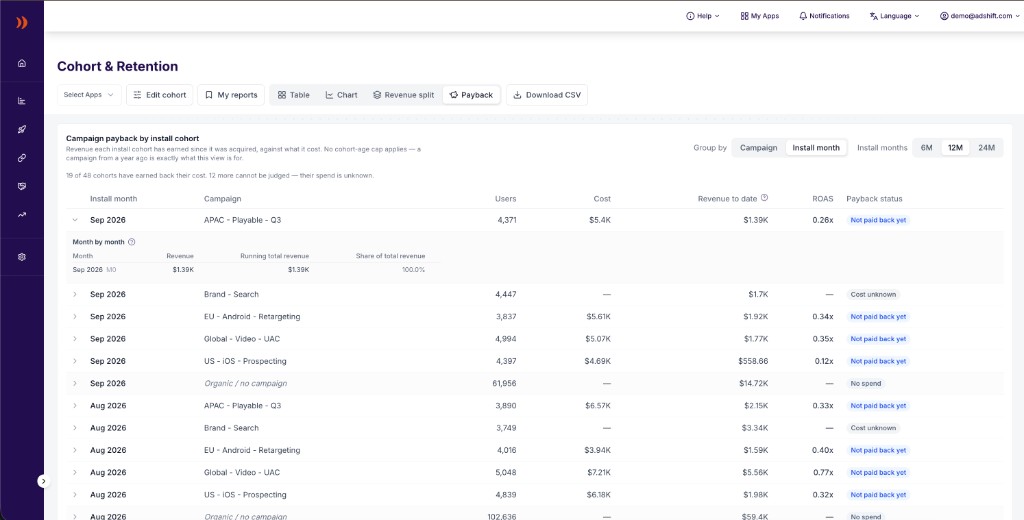
In Install month grouping, each row is one campaign in one install month. Open a row to see the month-by-month revenue walk behind that cohort's lifetime total.
Read the Campaign grouping in layers:
- The campaign row is a summary across install cohorts in the selected window.
- Opening the campaign shows the cohort rows that were added together.
- Opening a cohort shows the month-by-month revenue walk behind that cohort's lifetime total.
The campaign-level Revenue to date is still not "revenue in this calendar month." It is the sum of lifetime revenue to date for the install cohorts included under that campaign. For example, a campaign shown as Jul 2026 – Aug 2026 combines the July install cohort and the August install cohort. The July cohort may include revenue earned in July and August; the August cohort can only include revenue earned from August onward.
The campaign-level Cohorts paid back badge is a count, not a verdict for the whole campaign. A campaign can have older cohorts that paid back and newer cohorts that have not paid back yet. Open the campaign and read the cohort statuses before judging the trend.
Same campaign, different install cohorts
The same campaign can appear in several install months. That is expected and is the core idea of the Payback view.
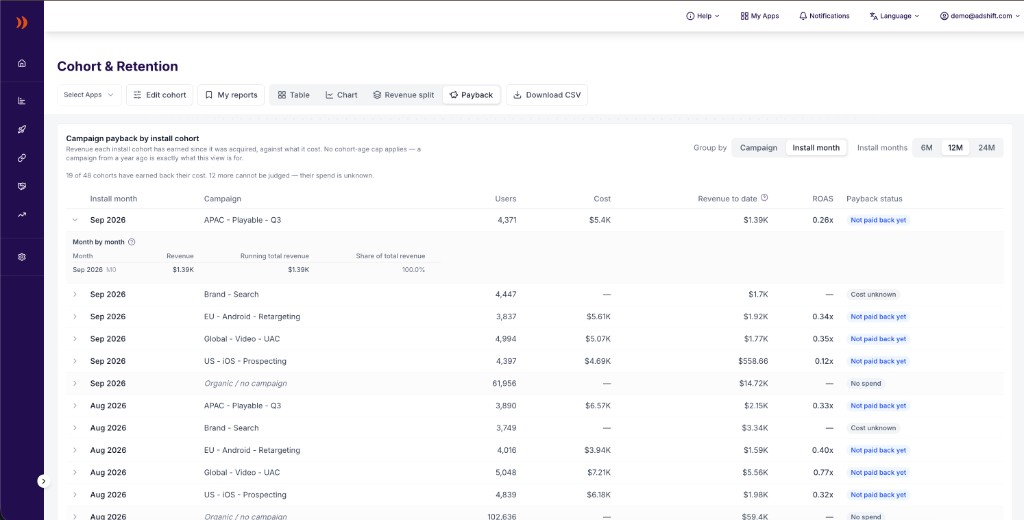
The same campaign name can show up under August and September because those are different groups of users acquired by that campaign.
Read it this way:
- Jul 2026 + campaign X means users acquired by campaign X in July. Open the row to see revenue those July users produced in July, August, and later months.
- Aug 2026 + campaign X means users acquired by campaign X in August. Open the row to see revenue those August users produced from August onward.
The expanded list is not "the months when this campaign ran." It is the revenue timeline for that one install cohort. A July cohort can have July and August revenue. An August cohort cannot have July revenue, because those users had not installed yet.
Table columns
| Column | What it means |
|---|---|
| Install month | The month the cohort was acquired. In Retargeting view this becomes Re-engagement month. |
| App | The app the row belongs to. Shown when multiple apps are selected, because organic / no-campaign rows exist separately for each app. |
| Campaign | Campaign name when available, otherwise campaign ID. Organic traffic is shown as Organic / no campaign, never as the raw NO_CAMPAIGN sentinel. |
| Users | Size of the cohort: users acquired in that app, campaign, and install month. |
| Cost | Spend attributed to that app, campaign, and install month. Blank when spend cannot be matched. |
| Revenue to date | Cohort-attributable revenue earned by these users from install month through today. |
| ROAS | Revenue to date divided by Cost. Blank when cost is unknown or zero. |
| Payback status | The status of the row: paid back, not paid back yet, cost unknown, or no spend. |
Rows are newest cohorts first. Within the same month, larger revenue appears first.
What to look for
- Rows marked Paid back after N mo already broke even;
Nis the cohort age at first payback. - Not paid back yet means cost is known, but cumulative revenue has not reached cost yet. It is not a final failure state, because the cohort can still earn revenue later.
- Cost unknown means spend could not be matched, so ROAS and payback are intentionally blank.
- No spend is used for organic / no-campaign traffic. It is not a paid campaign, so it is excluded from payback counts.
The four payback states
Payback keeps the states factual. A cohort can keep earning revenue after today, so an unpaid cohort is shown as Not paid back yet rather than as a final failure.
| State | What it means | How to read it |
|---|---|---|
| Paid back | Cumulative revenue has reached or passed cost. | The badge shows when the cohort first covered its acquisition cost, for example Paid back after 2 mo. |
| Not paid back yet | Cost is known, but cumulative revenue has not reached cost yet. | No final verdict. The cohort may still pay back later, especially if it is young. |
| Cost unknown | Revenue exists, but no matching spend was found. | No payback verdict. The campaign may or may not have paid back; the data needed to divide revenue by cost is missing. |
| No spend | Organic or unattributed traffic, not a paid campaign. | Excluded from payback counts. The revenue still matters, but there is no spend to earn back. |
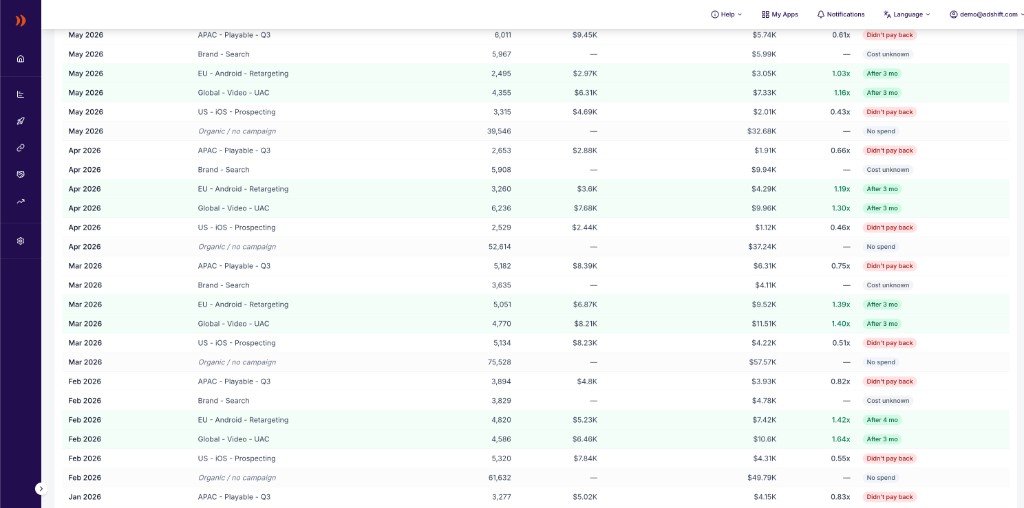
The status is factual: paid cohorts show when they reached break-even; unpaid cohorts stay as Not paid back yet because they can still earn more revenue later.
Organic / no campaign
Organic and unattributed installs arrive from the cohort marts under the NO_CAMPAIGN sentinel. The UI shows them as Organic / no campaign.
These rows are split per app. That matters when several apps are selected: NO_CAMPAIGN is not a real campaign ID, it is the no-campaign bucket every app can emit. Combining those rows would mix different apps' organic cohorts.
Organic rows show No spend. They are left out of the payback count because there was no ad spend to recover. Their users and revenue still appear so you can compare organic quality with paid cohorts.
Where cost comes from
Spend is aggregated from every connected cost source:
- partner API integrations such as Meta, Google, Apple Search Ads, and TikTok,
- uploaded CSV cost reports.
Cost is matched at app, campaign, and install-month grain. If spend cannot be matched to a row, the dashboard leaves Cost blank and marks the row Cost unknown. It does not turn missing spend into zero, because zero would make the campaign look like it earned revenue for free.
Retargeting spend is split using the campaign objective reported by the ad network. Campaigns without a classified objective may be counted in both User Acquisition and Retargeting views, so read retargeting cost with that limitation in mind.
Truncated campaign lists
The table returns the 50 highest-spending campaigns for the selected filters.
The cap is by campaign, not by row. That keeps all visible cohorts for the campaigns that matter most. Campaigns are ranked by spend, with revenue used only as a fallback. A campaign that spent heavily and earned little is more important to see than a campaign that earned revenue without much spend.
If the result is truncated, the dashboard tells you how many campaigns are shown and how many matched your filters. Narrow the app, media source, campaign, or install-month window to inspect the rest.
View type
Unlike Revenue split, Payback follows the Cohort page's view type:
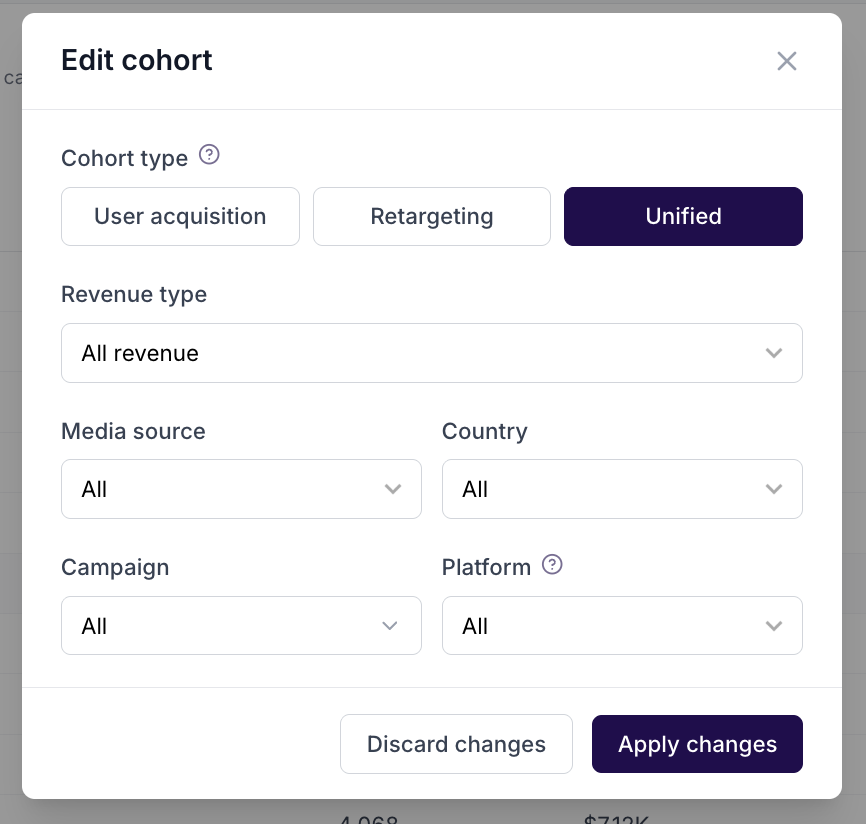
Unlike Revenue split, Payback follows the selected cohort type, so it can be used for User Acquisition, Retargeting, or Unified analysis.
- User Acquisition — install cohorts judged against acquisition spend.
- Retargeting — re-attribution and re-engagement cohorts judged against retargeting spend where it can be split.
- Unified — the broadest view, where each event is counted once.
Use User Acquisition to evaluate acquisition campaigns. Use Retargeting when the question is whether re-engagement spend returned enough revenue inside retargeting windows.
Why Payback does not match Overview revenue
Payback and Overview do not total the same axis.
Overview asks: "How much revenue happened during this calendar period?" If you select August, it sums revenue events that happened in August, no matter when the users installed.
Payback asks: "How much have the users acquired by these install cohorts earned since they were acquired?" If a row says Jun 2026, it follows users who installed in June and includes revenue they produced in June, July, August, and later months.
So the same revenue matrix can be read in two directions:
| Install cohort | Revenue in Jun | Revenue in Jul | Revenue in Aug | Payback reads this row as |
|---|---|---|---|---|
| Users installed in Jun | Jun revenue | Jul revenue | Aug revenue | Lifetime revenue of the Jun cohort |
| Users installed in Jul | — | Jul revenue | Aug revenue | Lifetime revenue of the Jul cohort |
| Users installed in Aug | — | — | Aug revenue | Lifetime revenue of the Aug cohort |
| Overview August | Sum of the Aug column |
That is why summing Revenue to date across Payback rows can be higher than Overview revenue for one month. Payback may include several months of revenue for each selected install cohort. Overview includes only the revenue events inside the selected calendar period.
There is one real gap to know about: Payback uses cohort-attributable revenue, meaning revenue that can be tied back to users in a cohort. Overview can include revenue with no traceable install, such as a subscription webhook without an ADSHIFT_DEVICE_ID. That revenue is valid in Overview, but cannot be assigned to a campaign cohort, so it will not appear in Payback or Revenue split.
CSV export
The CSV export contains the rows shown by the Payback table.
Columns:
app_id, cohort_month, campaign_id, campaign_name, cohort_size, cost, cost_state, cumulative_revenue, roas, roi, payback_month, currencyRead payback_month together with cost_state:
cost_state = knownandpayback_monthhas a value — the cohort paid back after that many months.cost_state = knownandpayback_monthis blank — cost is known and the cohort has not paid back yet.cost_state = unknown— no payback verdict is possible because spend is missing.cost_state = no_spend— organic / no-campaign row; there was no spend to earn back.
Do not treat blank payback_month as "failed" without checking cost_state.
FAQ
Why does Payback use install month instead of the dashboard date picker?
Payback judges the users acquired in a month and follows them forward to today. The date picker on the daily Cohort table selects conversion dates for day-by-day retention, which is a different question.
Why are organic rows shown at all?
They provide a quality benchmark. Organic users have no spend to recover, but their cohort size and revenue help you compare paid campaigns against organic behavior.
Why is cost sometimes blank?
Cost is blank when spend cannot be honestly matched at app, campaign, and install-month grain, or when the row is organic. The dashboard avoids turning unknown spend into $0.
Why can recent campaigns show "Not paid back yet" even with low ROAS?
Because the cohort has not covered its cost yet. This is intentionally factual, not a final verdict: recent cohorts may still earn revenue later.
Why does summing Payback revenue not match Overview?
Payback follows install cohorts over their lifetime to date. Overview reports event-date revenue for a calendar period, and can include revenue that cannot be assigned to a campaign cohort.
See also
- Revenue split by install cohort — how each revenue month divides between new and older install cohorts
- Cohort and retention — daily cohort table, lifetime curves, retention, ARPU, sessions, and cost KPIs
SKAN Overview
Read your iOS SKAdNetwork results — decoded installs and revenue, with diagnostics for how trustworthy the SKAN signal is.
Cohort and retention
Measure how users acquired on the same date behave over time: retention, revenue, ARPU, sessions and cost KPIs (eCPI, ROAS, ROI), split by UA, Retargeting or Unified view.