

Revenue split by install cohort
See how each month's revenue divides between users installed that month and users acquired earlier, and why this cohort total can differ from Overview.
Revenue split shows how much of each calendar month's revenue came from users installed in that same month, and how much came from users acquired earlier who are still monetizing.
Use it when you want to separate new acquisition revenue from the value of your existing installed base. Overview tells you how much revenue happened in a date range. The daily Cohort and retention view follows cohorts by user age (D0, D1, D7...). Revenue split sits between them: it keeps calendar months on the horizontal axis, but splits each month by install cohort.
Open Analyze -> Cohort & Retention, then select the Revenue split tab.
Use this view when you want to understand whether monthly revenue is coming from fresh installs or from users acquired earlier.
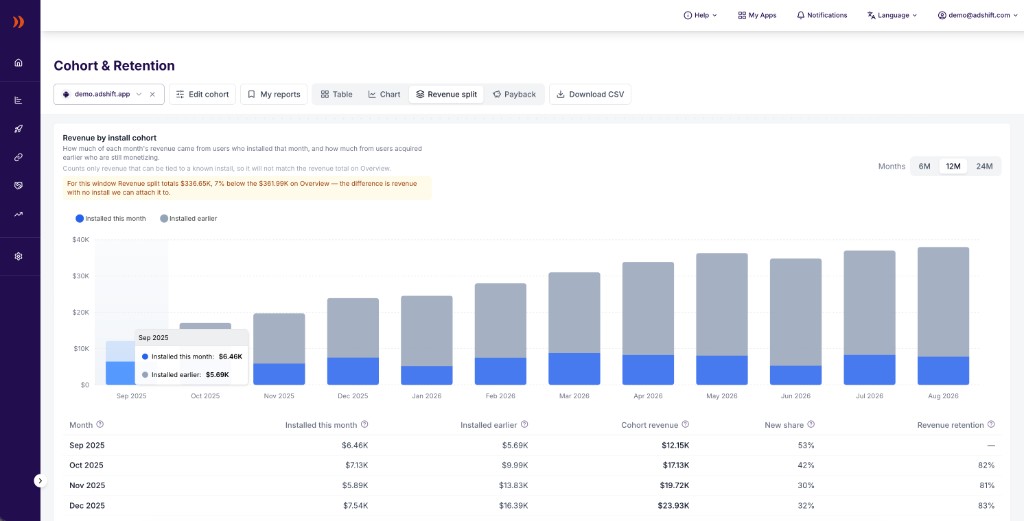
Revenue split separates each calendar month into revenue from users installed that month and users installed earlier.
How to read this screen
Start with the stacked bars. Blue is revenue from users who installed in the same month. Gray is revenue from users installed earlier. A growing gray segment usually means the existing user base is carrying more of the business; a large blue segment means the month depends more on fresh acquisition.
Then check the table below the chart. The same split is shown numerically, together with Share from new users and Existing cohort revenue retention. If the info note appears, it explains why the cohort-attributable total is lower or higher than Overview for the same window.
What the chart shows
The chart is a stacked bar chart. Each bar is one calendar month of revenue:
- Installed this month (blue) — revenue earned during that month by users who installed in that same month.
- Installed earlier (gray) — revenue earned during that month by users who installed in previous months.
If an app is younger than the selected window, the chart starts at the first month with revenue. Earlier months are not shown as empty bars because the app had no cohort history yet. If a zero-revenue month sits between months that do have revenue, it stays visible as a gap. That kind of gap is real information: the app had history, but no cohort revenue in that month.
Use the month selector to choose a 6, 12, or 24 month window. The dashboard defaults to 12 months.
The page-level date picker is hidden on this tab. That picker selects conversion dates for the daily cohort table, while Revenue split uses its own monthly reporting window.
Table columns
The table gives the same monthly split as the chart, with extra context.
| Column | What it means |
|---|---|
| Month | The calendar month the revenue was earned in, not the month those users installed. |
| Installed this month | Revenue earned in this month by users who installed during this same month. |
| Installed earlier | Revenue earned in this month by users who installed in any earlier month. This is the part of the month that this month's acquisition cannot take credit for. |
| Cohort revenue | Installed this month + Installed earlier. Only revenue that can be tied to a known install is counted. |
| Share from new users | Installed this month divided by Cohort revenue. A high share means the month depends heavily on fresh acquisition; a low share means the existing user base is carrying more of the month. |
| Existing cohort revenue retention | Shows how much revenue from the existing user base carried into the next month: this month's Installed earlier revenue divided by the previous month's Cohort revenue. See below. |
The Window total row sums the displayed window. It is a column total, not another month.
What to look for
- A high Installed this month value means current acquisition is responsible for much of the month's revenue.
- A high Installed earlier value means previous cohorts are still monetizing.
- A falling Share from new users is usually healthy when total revenue is stable or growing: older cohorts are contributing more.
- A blank Existing cohort revenue retention does not mean 0%. It means the previous month needed for the comparison is unavailable or partial.
Existing cohort revenue retention
Existing cohort revenue retention answers a simple question: how much revenue from the existing user base carried into the next month. It measures how the installed base performed from one month to the next.
Formula:
Existing cohort revenue retention =
  this month's "Installed earlier"
  / previous month's "Cohort revenue"
Those two numbers describe the same population one month apart: everyone who had installed by the end of the previous month. That is why this metric is less sensitive to fresh acquisition spend than Share from new users.
Existing cohort revenue retention can be above 100%. That does not automatically mean anything is wrong. It means the already-installed base earned more this month than the whole app earned in the previous month.
The value is blank when the previous month is not available, or when the previous month is the app's first month of cohort history. First months are often partial: for example, if tracking starts on June 10, June has only part of a month in the denominator. Dividing July revenue by that partial June total can produce an inflated number, so the dashboard leaves the value blank instead of showing a misleading spike.
Filtering by campaign and other dimensions
Open Edit cohort to narrow Revenue split before reading the chart or table. These filters apply to the cohort-attributable revenue in this view, so they are useful when you want to answer the same "new vs existing users" question for one campaign, one media source, one country, one platform, or one revenue stream.
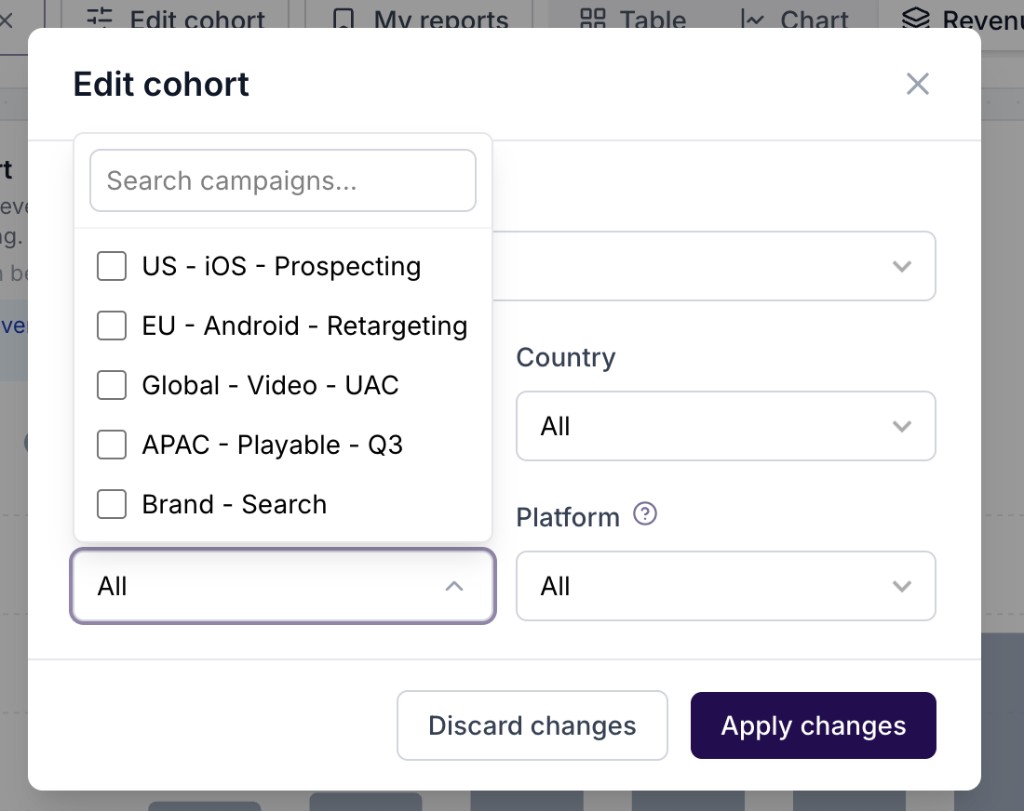
Use the Campaign filter in Edit cohort to read Revenue split for one campaign or a selected set of campaigns. The same modal also contains Revenue type, Media source, Country, and Platform filters.
For example, if you select a single campaign and look at July:
- Installed this month shows July revenue from users who installed from that campaign in July.
- Installed earlier shows July revenue from users who installed from that same campaign in earlier months and were still monetizing in July.
- Cohort revenue is the sum of those two values for the selected campaign and the selected filters.
The same pattern works for the other filters in Edit cohort:
- Revenue type switches between all revenue, in-app purchase / subscription revenue, and ad revenue.
- Media source narrows the view to a specific source, such as organic or a paid network.
- Country narrows the view to users attributed to that country.
- Campaign narrows the view to one or more selected campaigns.
- Platform narrows the view to iOS or Android.
When several filters are active, Revenue split shows only the revenue that matches all of them. Currency is still taken from the page-level currency selector.
Why this total can differ from Overview
Revenue split counts cohort-attributable revenue: revenue that can be tied back to a known install.
Overview counts revenue by event date. It can include revenue that arrived without a device identity or without a traceable install. Subscription webhooks are the common case: if a RevenueCat event arrives without an ADSHIFT_DEVICE_ID, AdShift can count it in Overview revenue, but cannot honestly assign it to an install cohort.
That means Revenue split is normally lower than Overview for the same window and filters. The gap is usually widest in an app's first months, when identity coverage is still ramping up.
When the gap is large enough to notice, the dashboard shows both numbers and the percentage difference. This is not necessarily a data defect: the two totals answer different questions.
Cohort breakdown
Use Show cohort breakdown to open the matrix behind the chart.
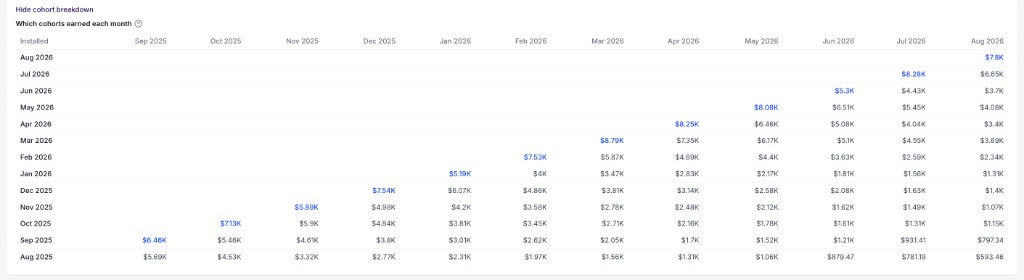
The cohort breakdown shows the install-month matrix behind the gray "Installed earlier" bar segments.
Each row is an install month. Each column is a revenue month. A cell answers: "How much revenue did users installed in this cohort earn during this calendar month?"
This is the detail behind the Installed earlier column. If July has a large Installed earlier value, the matrix shows whether it came mostly from June installs, from much older cohorts, or from several cohorts together.
View type
Revenue split is pinned to install cohorts.
The standard Cohort and retention dashboard can switch between User Acquisition, Retargeting, and Unified views. Revenue split deliberately does not follow that switch yet. If Unified were used here, a re-engaged old user could be grouped into the month of the re-engagement, making Installed this month stop meaning "users who installed this month."
Use this tab to read install-cohort revenue. Use the Payback tab when you need to evaluate retargeting cohorts against retargeting spend.
CSV export
The CSV export contains the full cohort matrix, not just the visible summary table.
Columns:
activity_month, cohort_month, months_since_install, revenue, currencyactivity_month— the calendar month the revenue was earned in.cohort_month— the month those users installed.months_since_install— age of the cohort in months, where 0 means install month.revenue— cohort-attributable revenue in the selected currency.
The visible table can be rebuilt from this file by grouping rows by activity_month and splitting months_since_install = 0 from months_since_install > 0.
FAQ
Why does Revenue split not equal Overview?
Overview counts revenue by event date. Revenue split counts only revenue that can be tied to a known install cohort. Revenue without a usable device/install identity can appear in Overview but not in Revenue split.
Why does the chart sometimes start later than the selected window?
The axis starts at the first month with cohort revenue. Leading empty months are left out so the chart does not look like missing data.
Why is Revenue retention blank for the first month?
The metric needs the previous month's cohort revenue as its denominator. If the previous month is outside retained history or partial, the dashboard leaves the value blank.
Can Revenue retention be above 100%?
Yes. It means users installed before this month earned more this month than the whole cohort-attributable total from the previous month.
See also
- Cohort and retention — daily cohort table, lifetime curves, retention, ARPU, sessions, and cost KPIs
- Campaign payback by install cohort — whether campaign cohorts earned back their spend
- Overview - Main Dashboard — calendar revenue, spend, installs, and ROAS in one place
Cohort and retention
Measure how users acquired on the same date behave over time: retention, revenue, ARPU, sessions and cost KPIs (eCPI, ROAS, ROI), split by UA, Retargeting or Unified view.
Network Self-Reports
Network Self-Reports shows performance data as reported directly by each ad network — spend, impressions, and campaign metrics from Meta, Apple, and TikTok.